

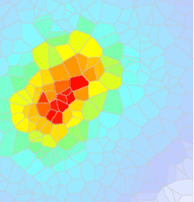
ShakeMap, developed by the USGS, facilitates communication of earthquake information beyond just magnitude and location. By rapidly mapping out earthquake ground motions, ShakeMap portrays the distribution and severity of shaking.
View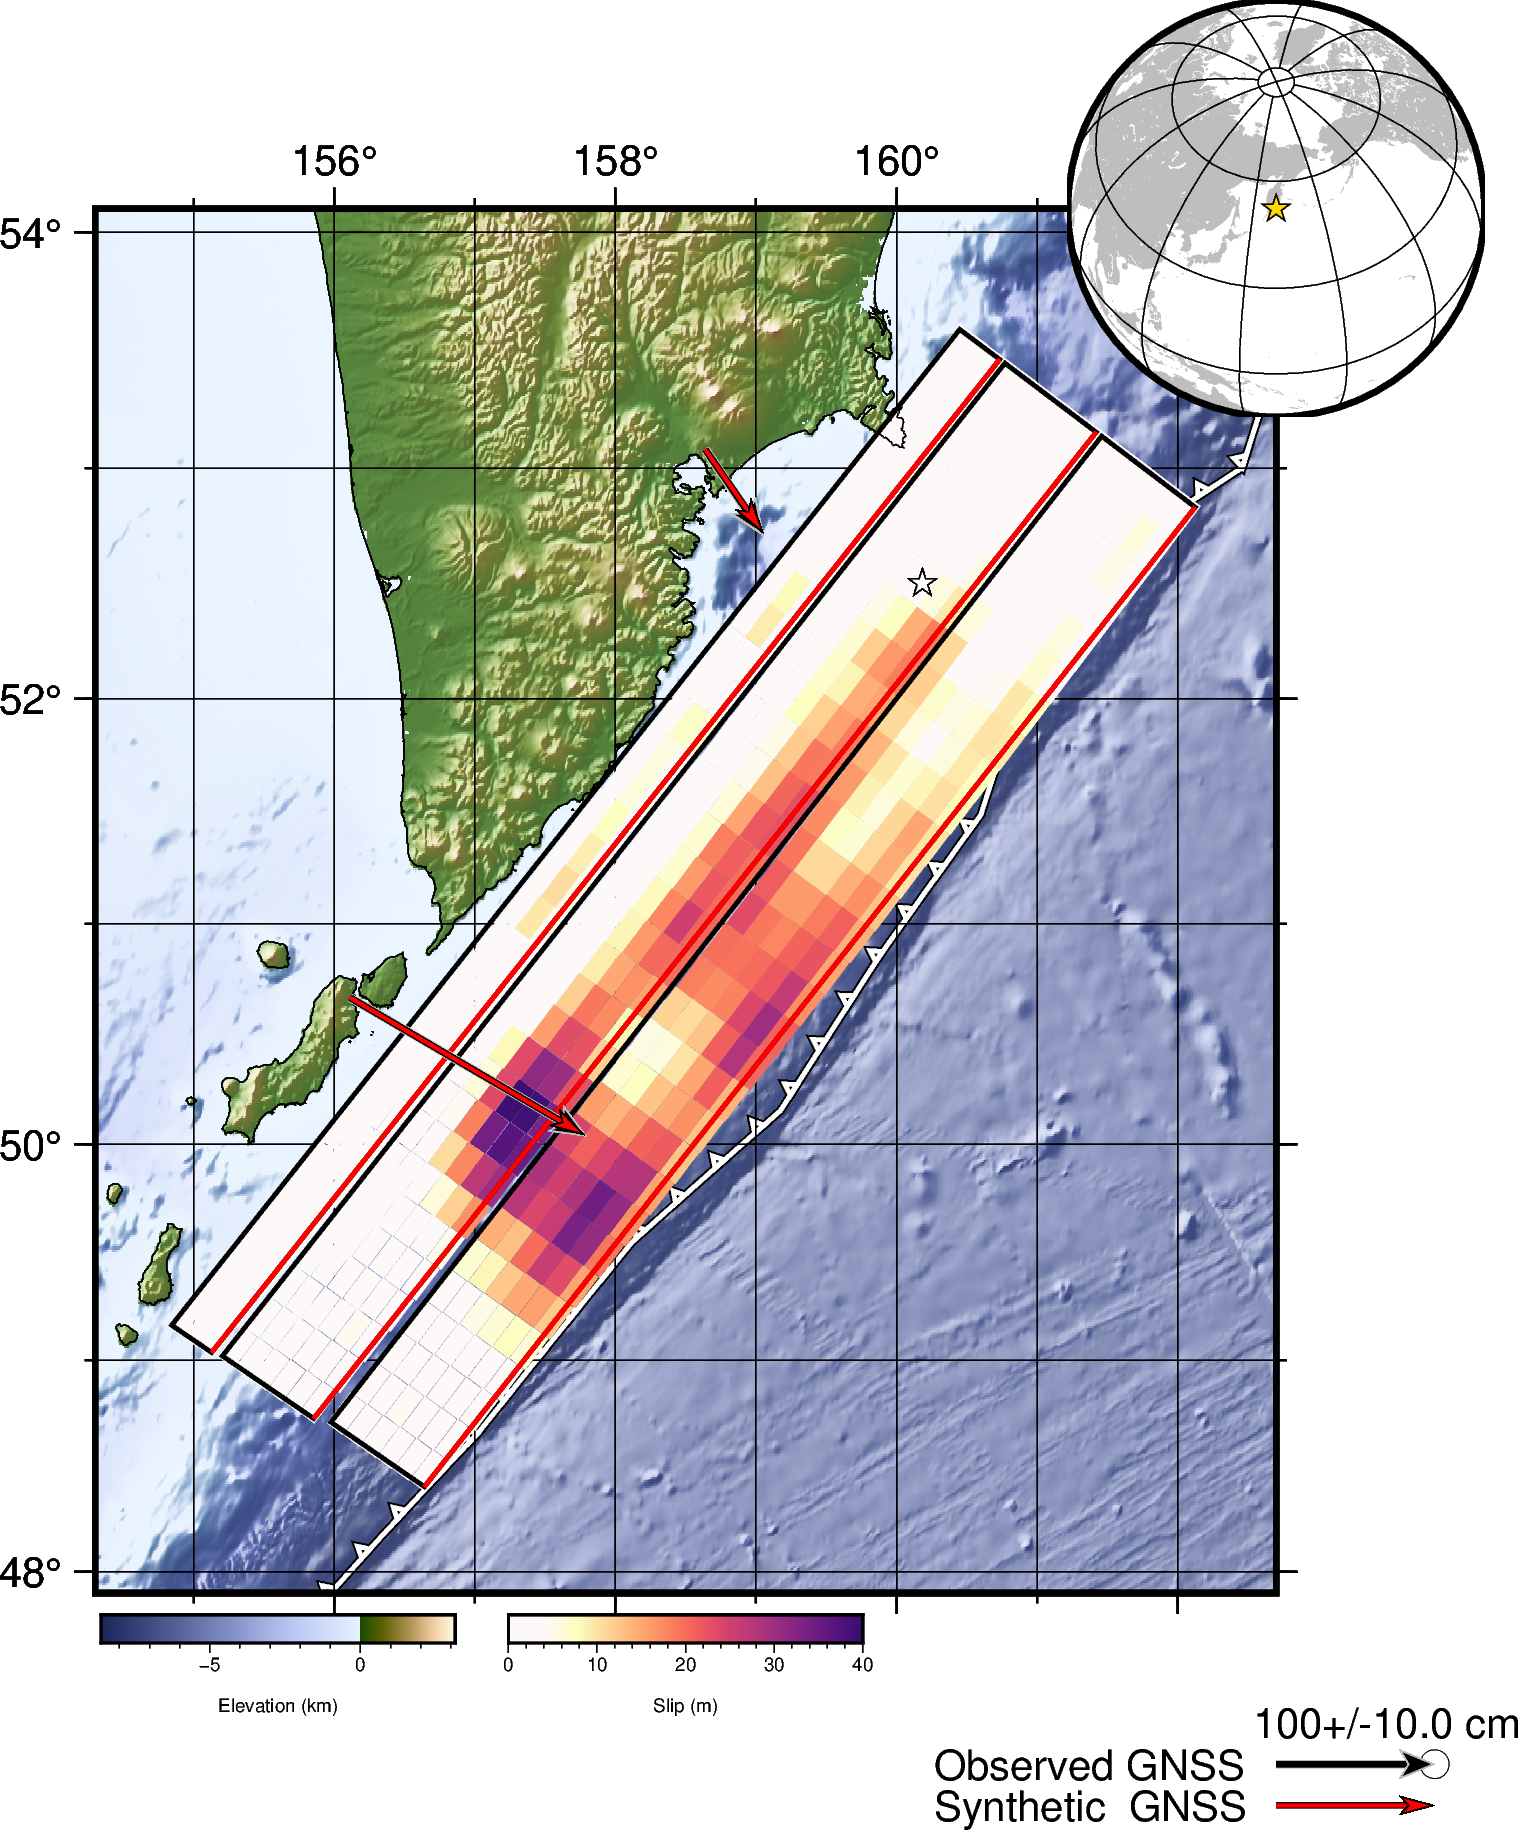
Finite fault models generated by the USGS generally employ a kinematic finite fault inversion in the wavelet domain.
View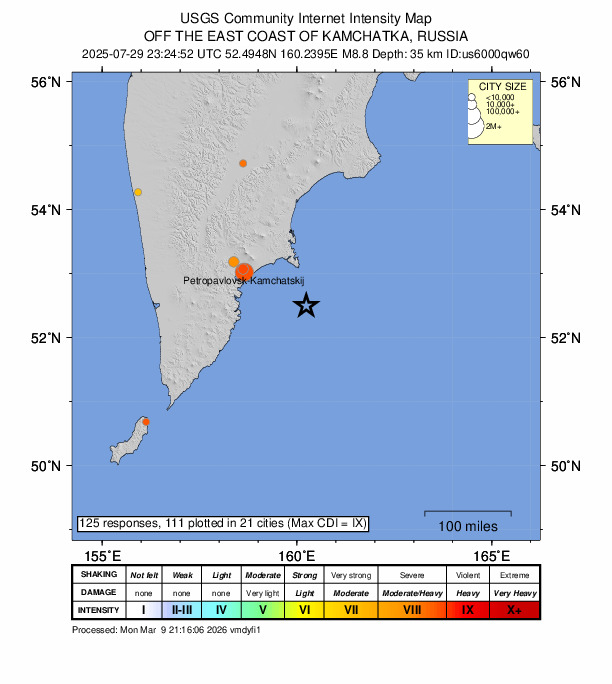
The USGS collects information from people who felt an earthquake and creates maps that show what people experienced and the extent of the damage.
View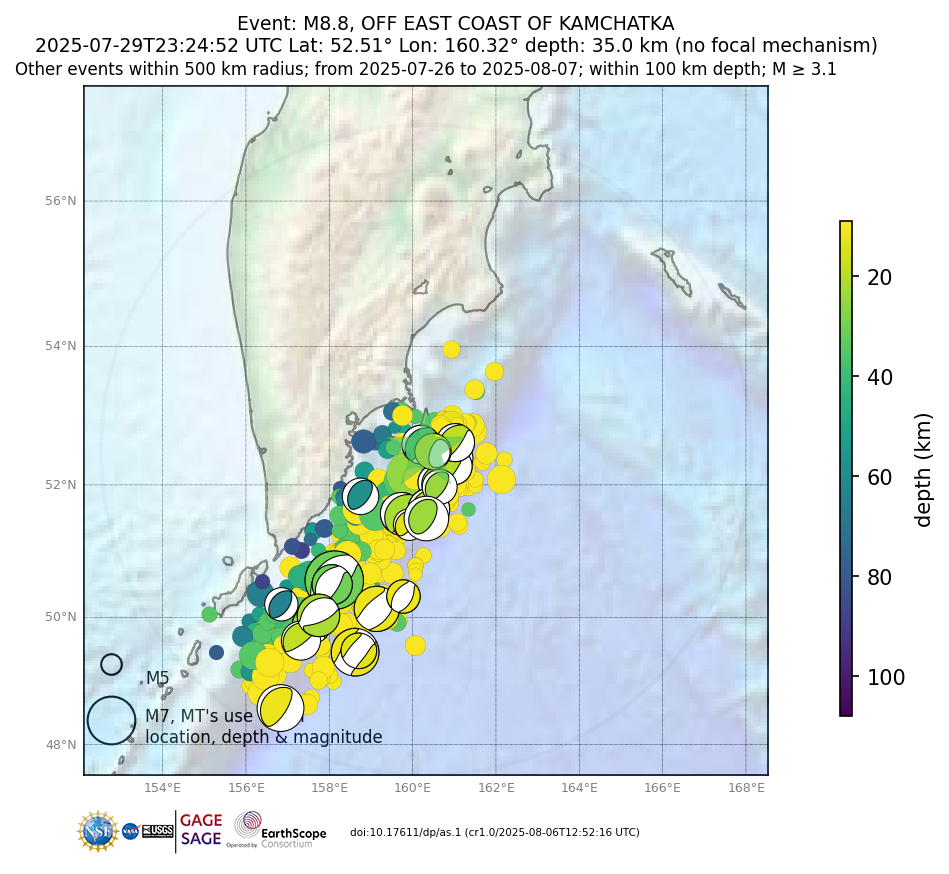
Aftershocks, smaller earthquakes that occur in the same general area during the days to years following a larger event or "mainshock."
View
Explore millions of earthquakes on a Google map. View epicenters in 2D, or rotate through hypocenters in 3D. Options allow changing Time, Magnitude, Depth, and more.
View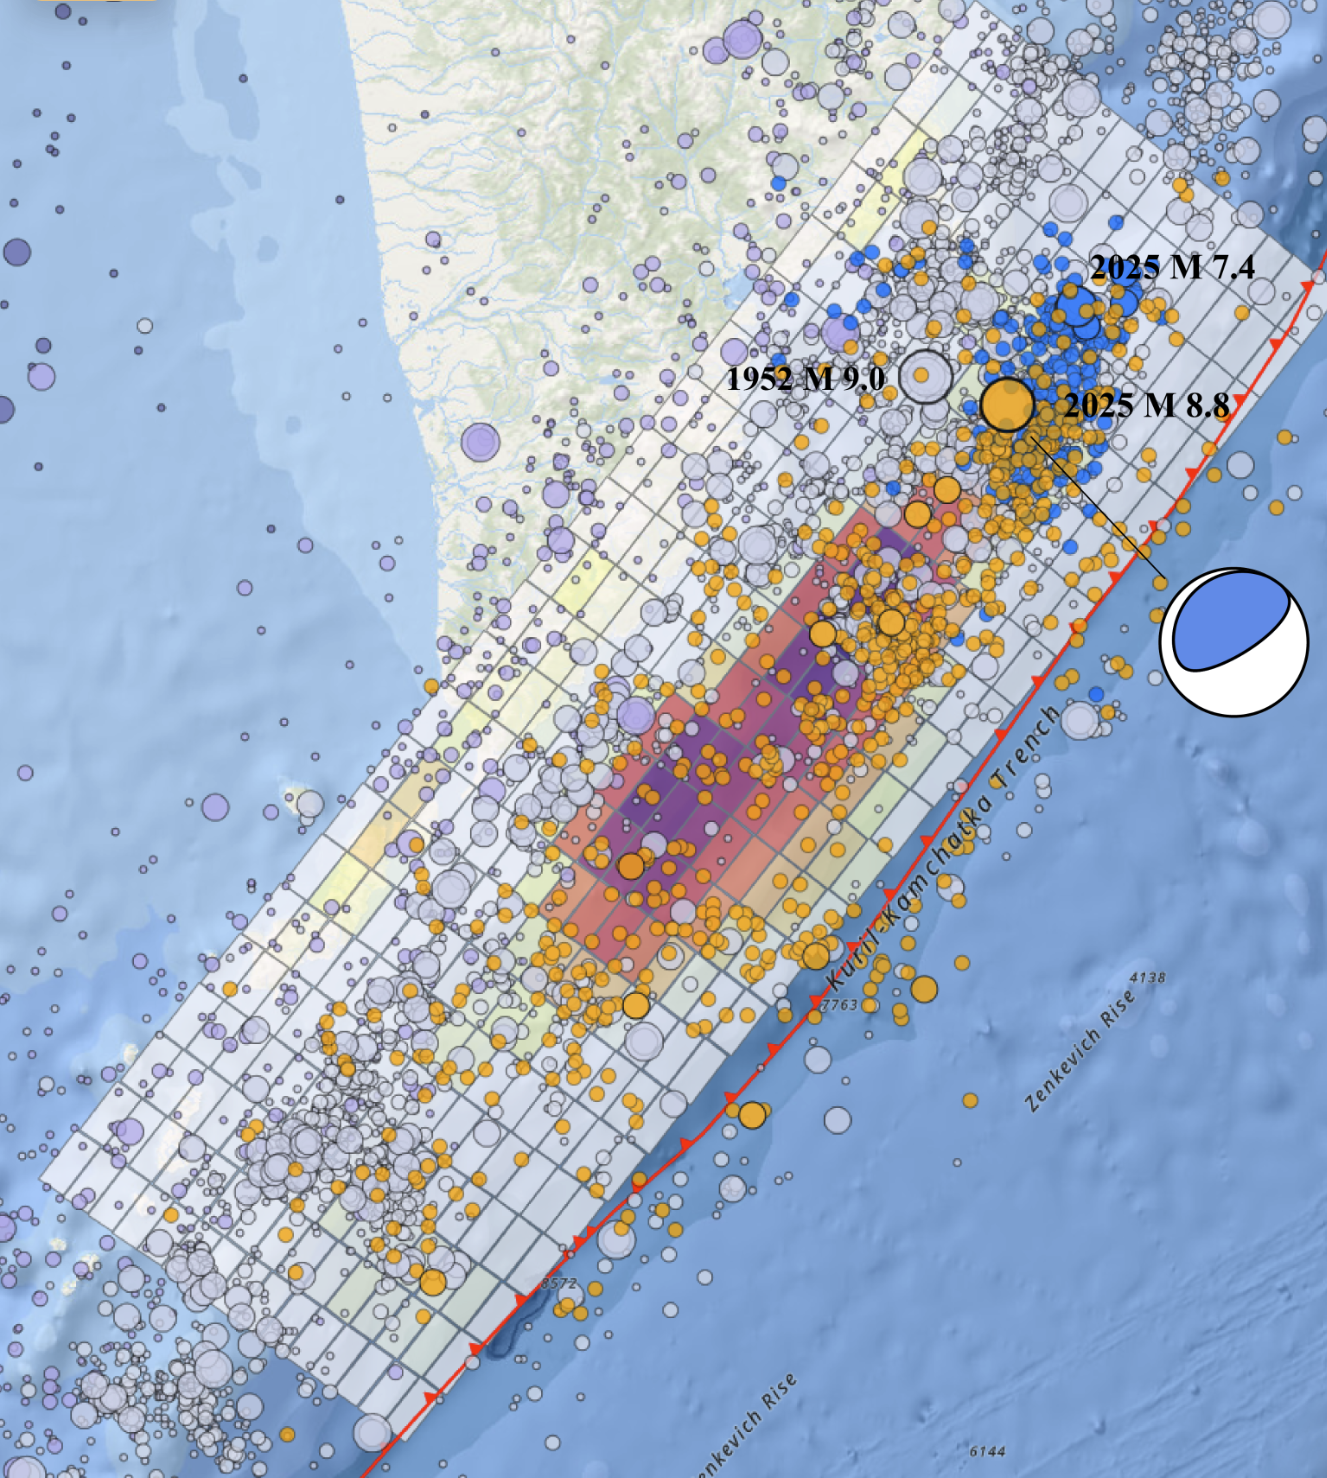
A geonarrative of the seismotectonics of the Kuril-Kamchatka subduction zone.
ViewData-generated visualizations show how the ground moves across the U.S. as seismic waves from moderate local or large distant earthquakes move across the surface of the Earth.
ViewA type of earthquake analysis using a seismograph network that gives researchers tools to examine detailed rupture propagation.
View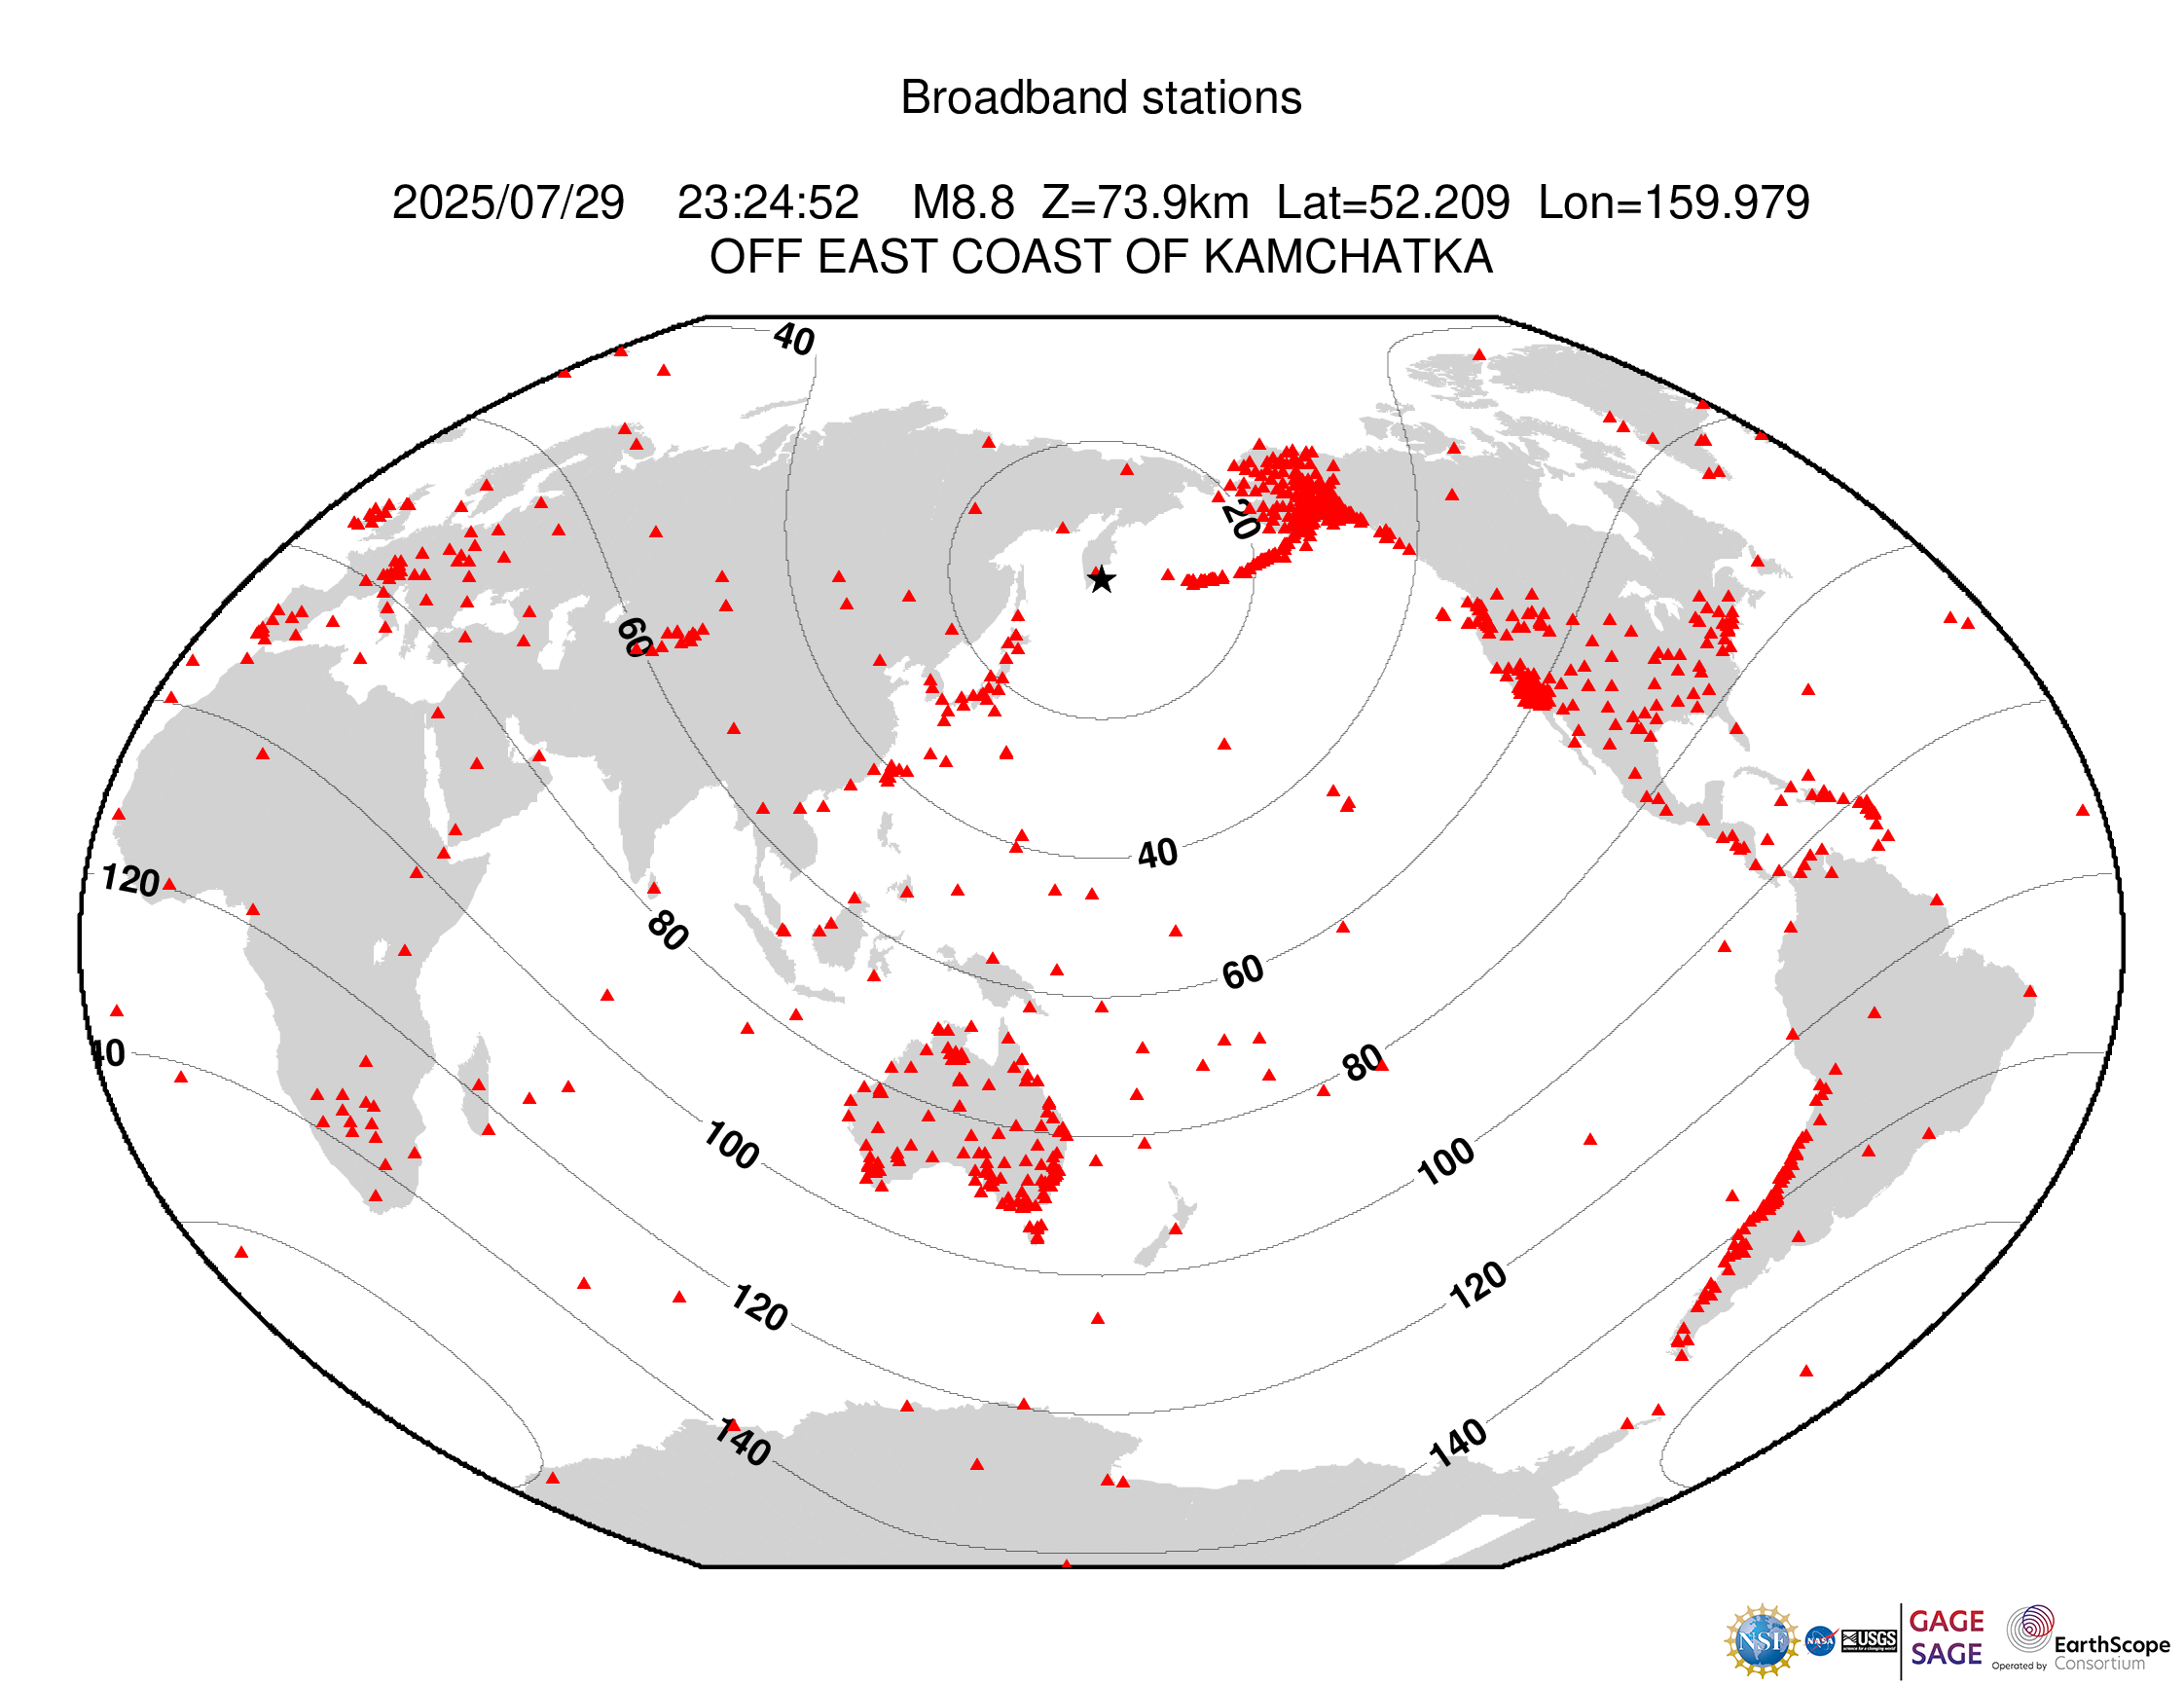
Suite of plots that are automatically generated following all earthquakes of magnitude 6 or greater that examine different facets of an earthquake.
View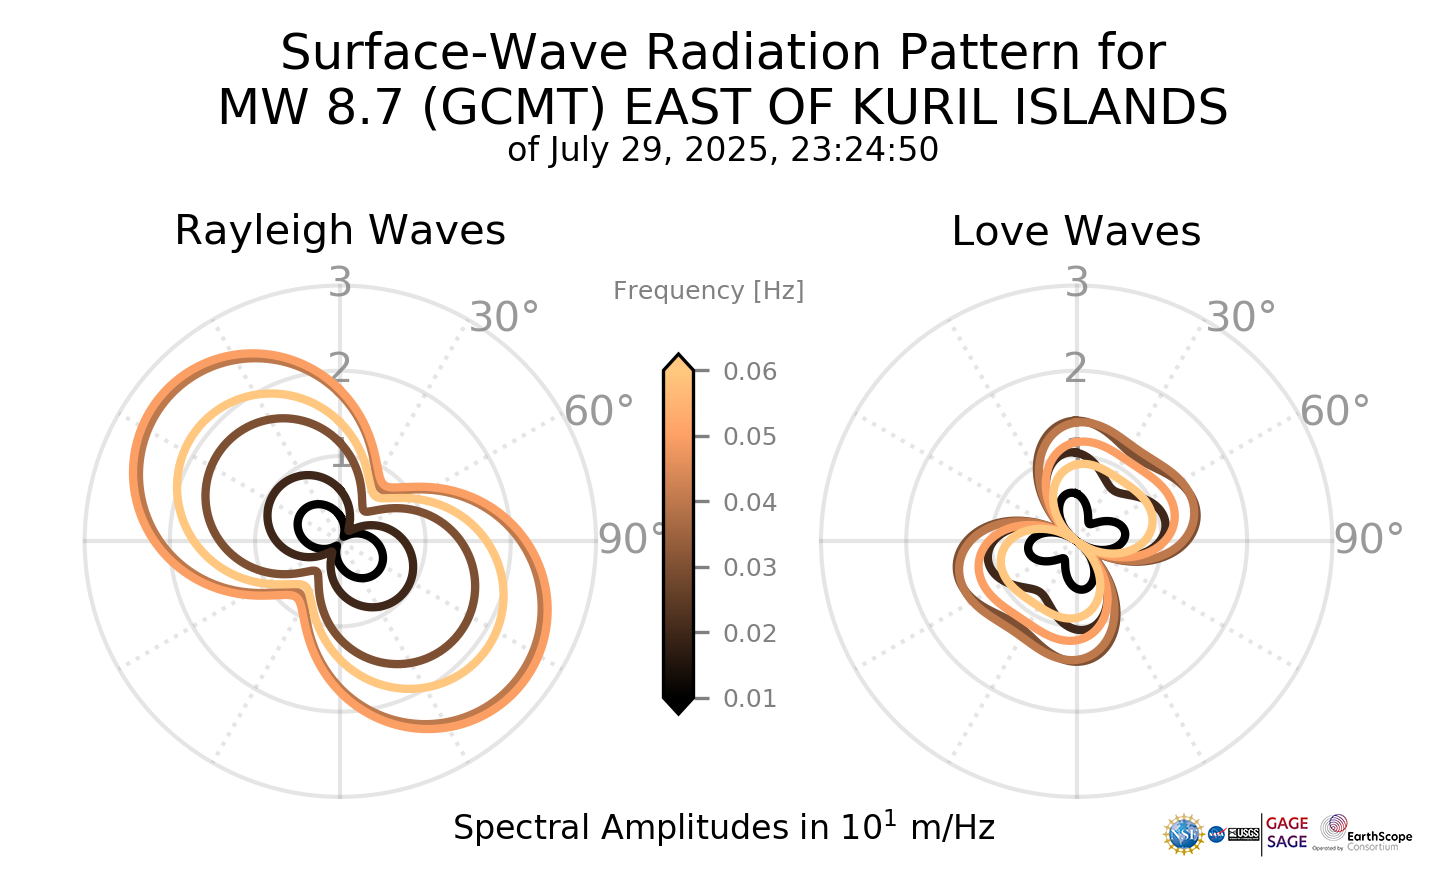
Initial quick-CMT solutions are available within minutes of an event and are later updated to full GCMT solutions when updates arrive.
View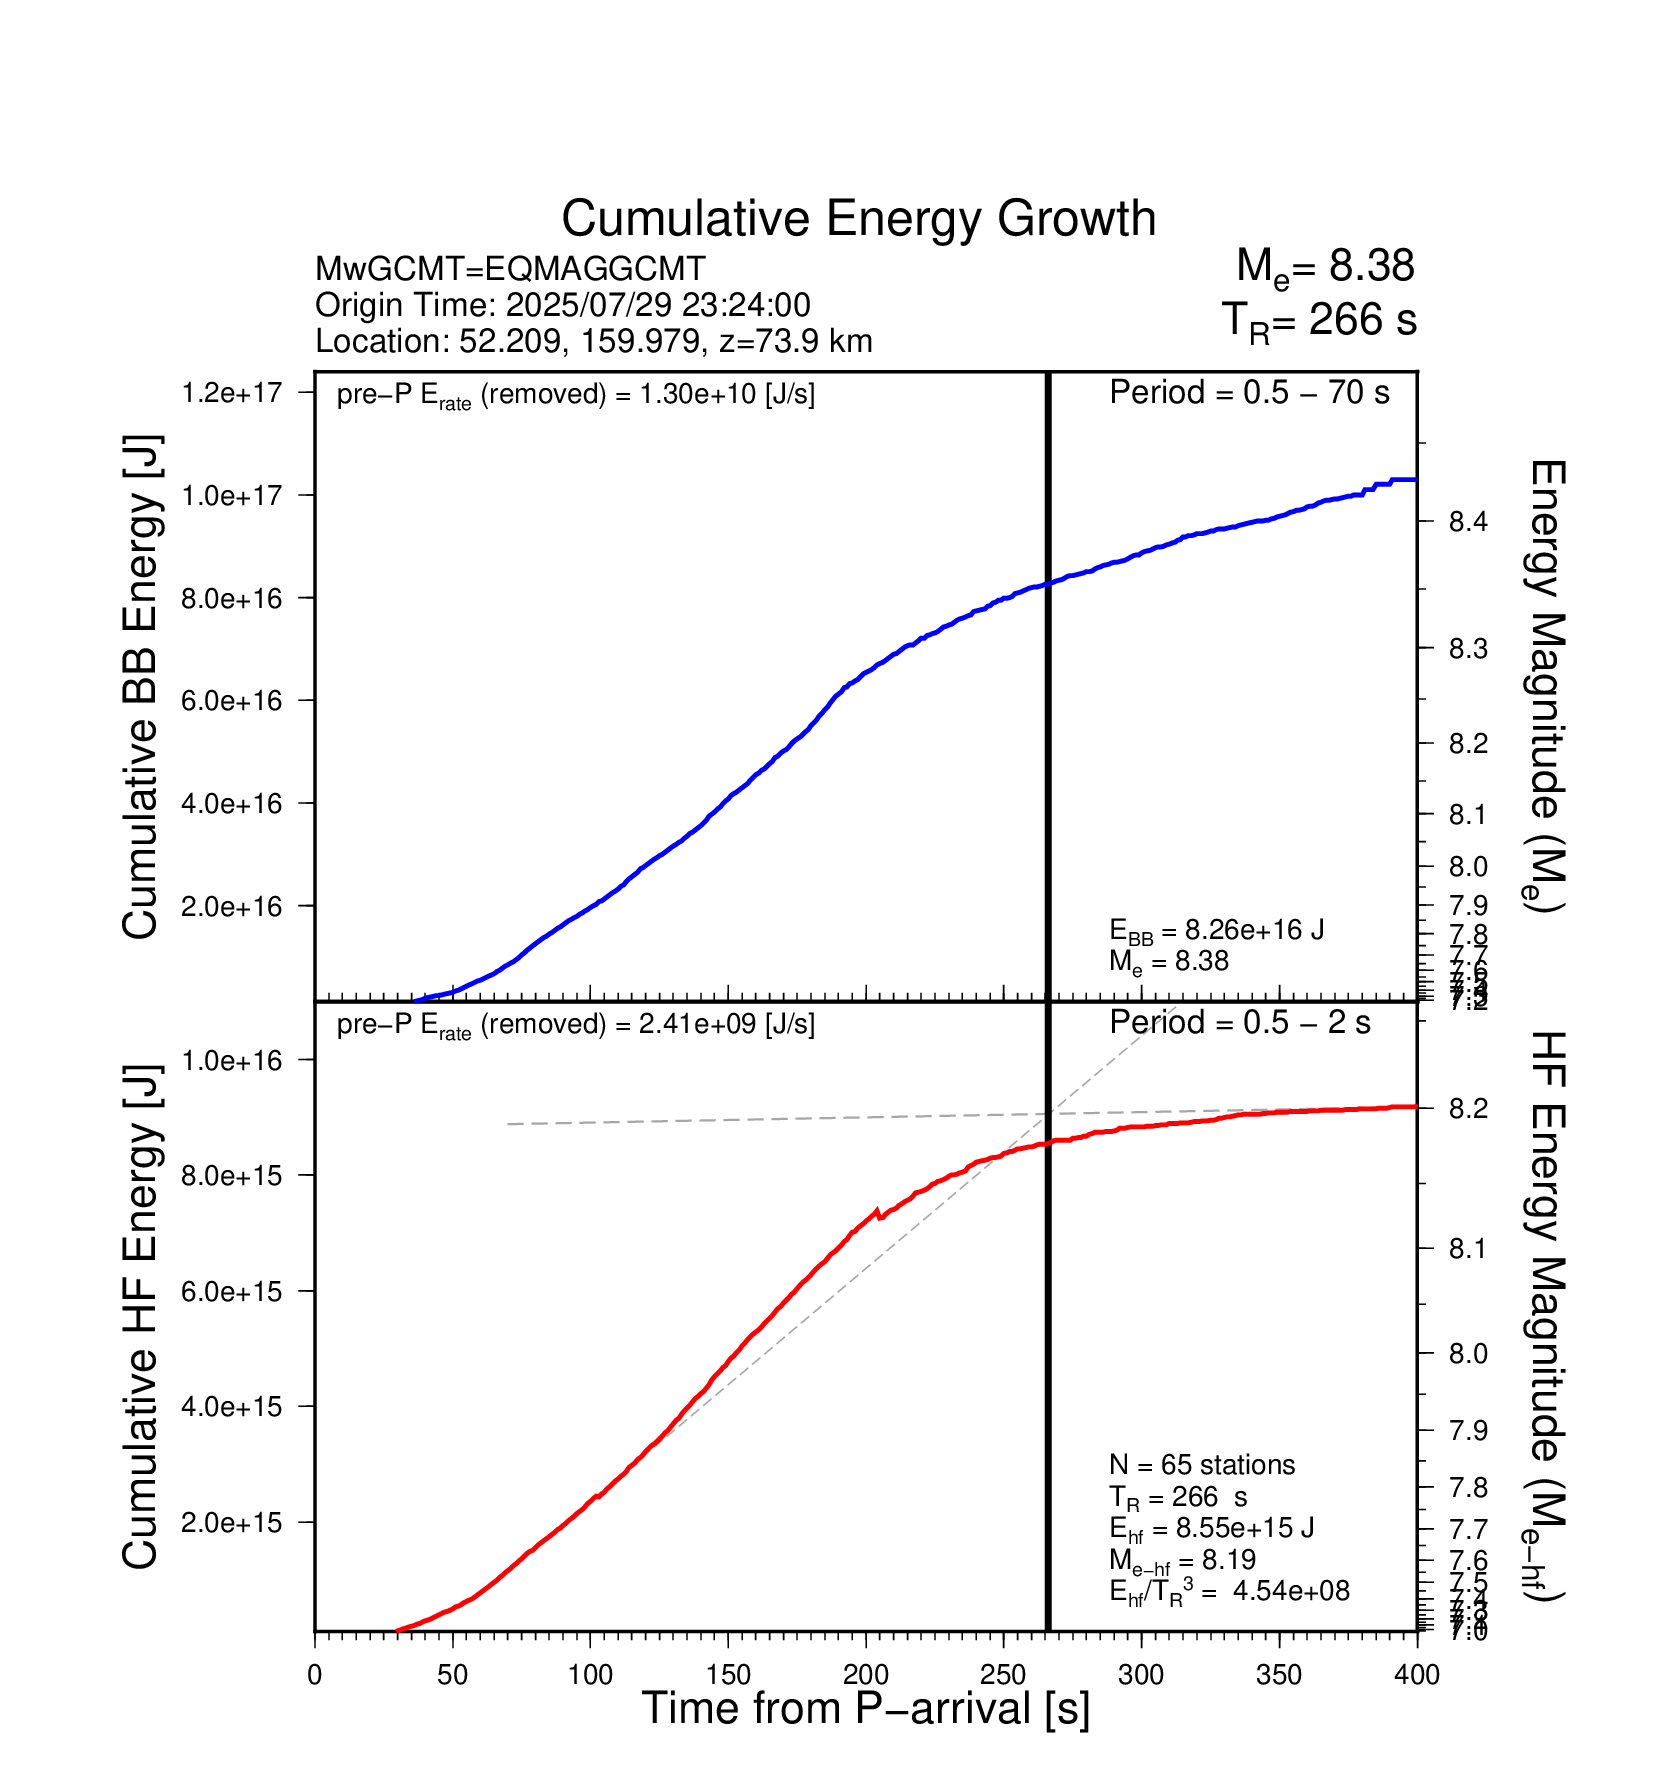
Earthquake energy is a measure of the kinetic energy released through seismic waves during an event
View
Download time series data based on this event.
View
Request instruments or other types of support for PI projects.
View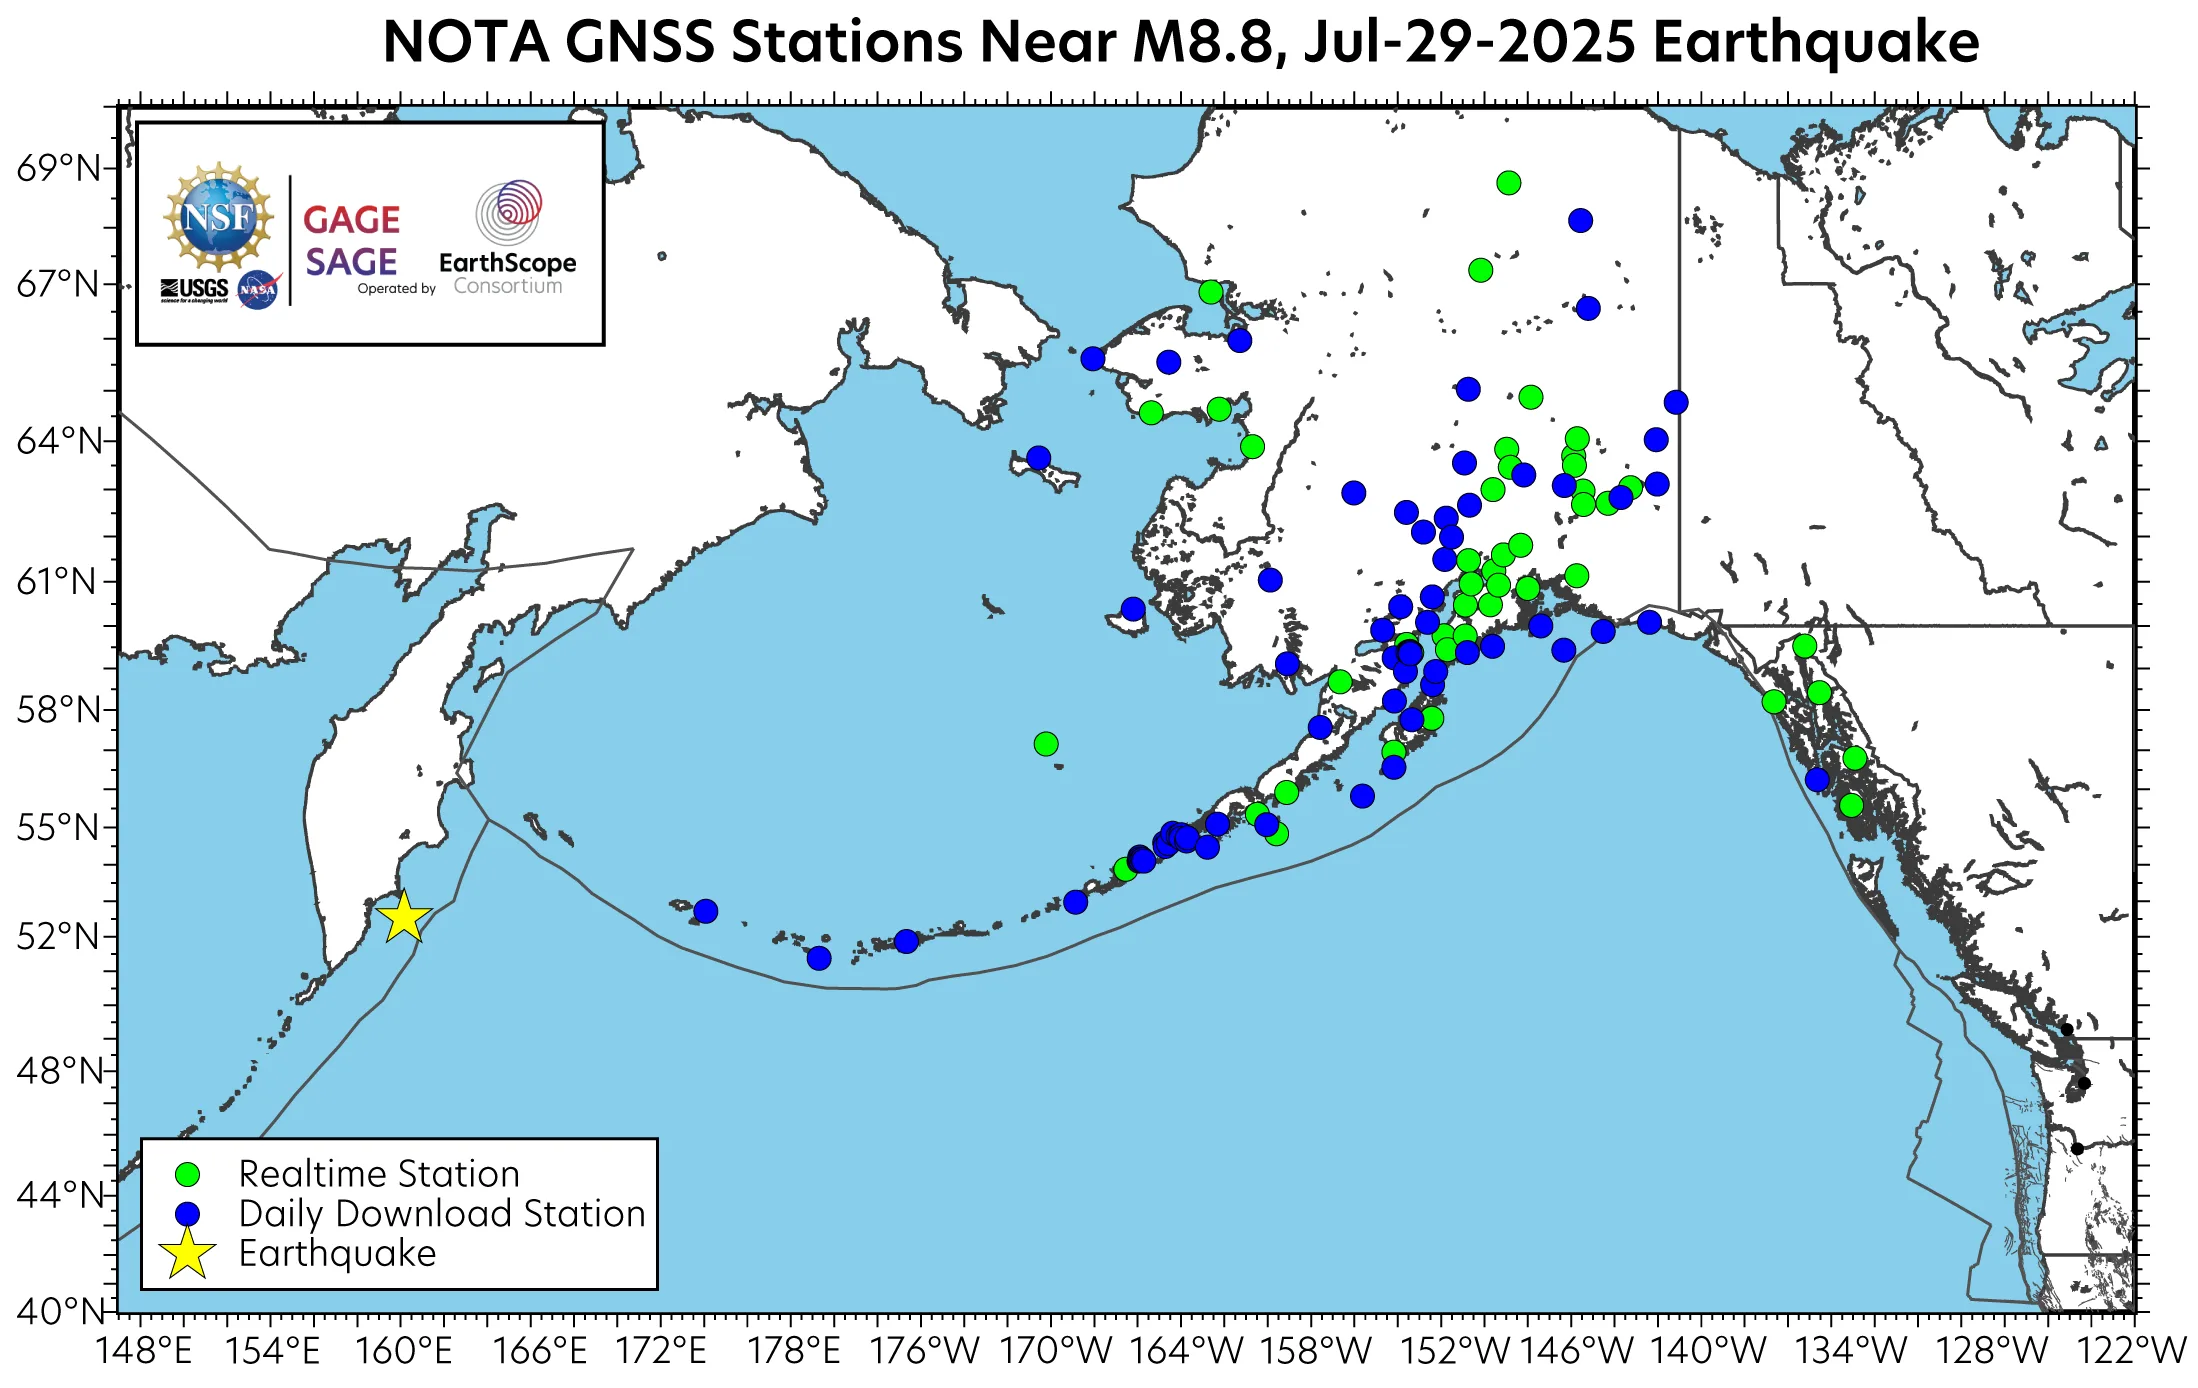
Map of NOTA stations within radius of 2 cm predicted displacement. See data access link for more information.
View
Data availability at nearby GNSS stations.
View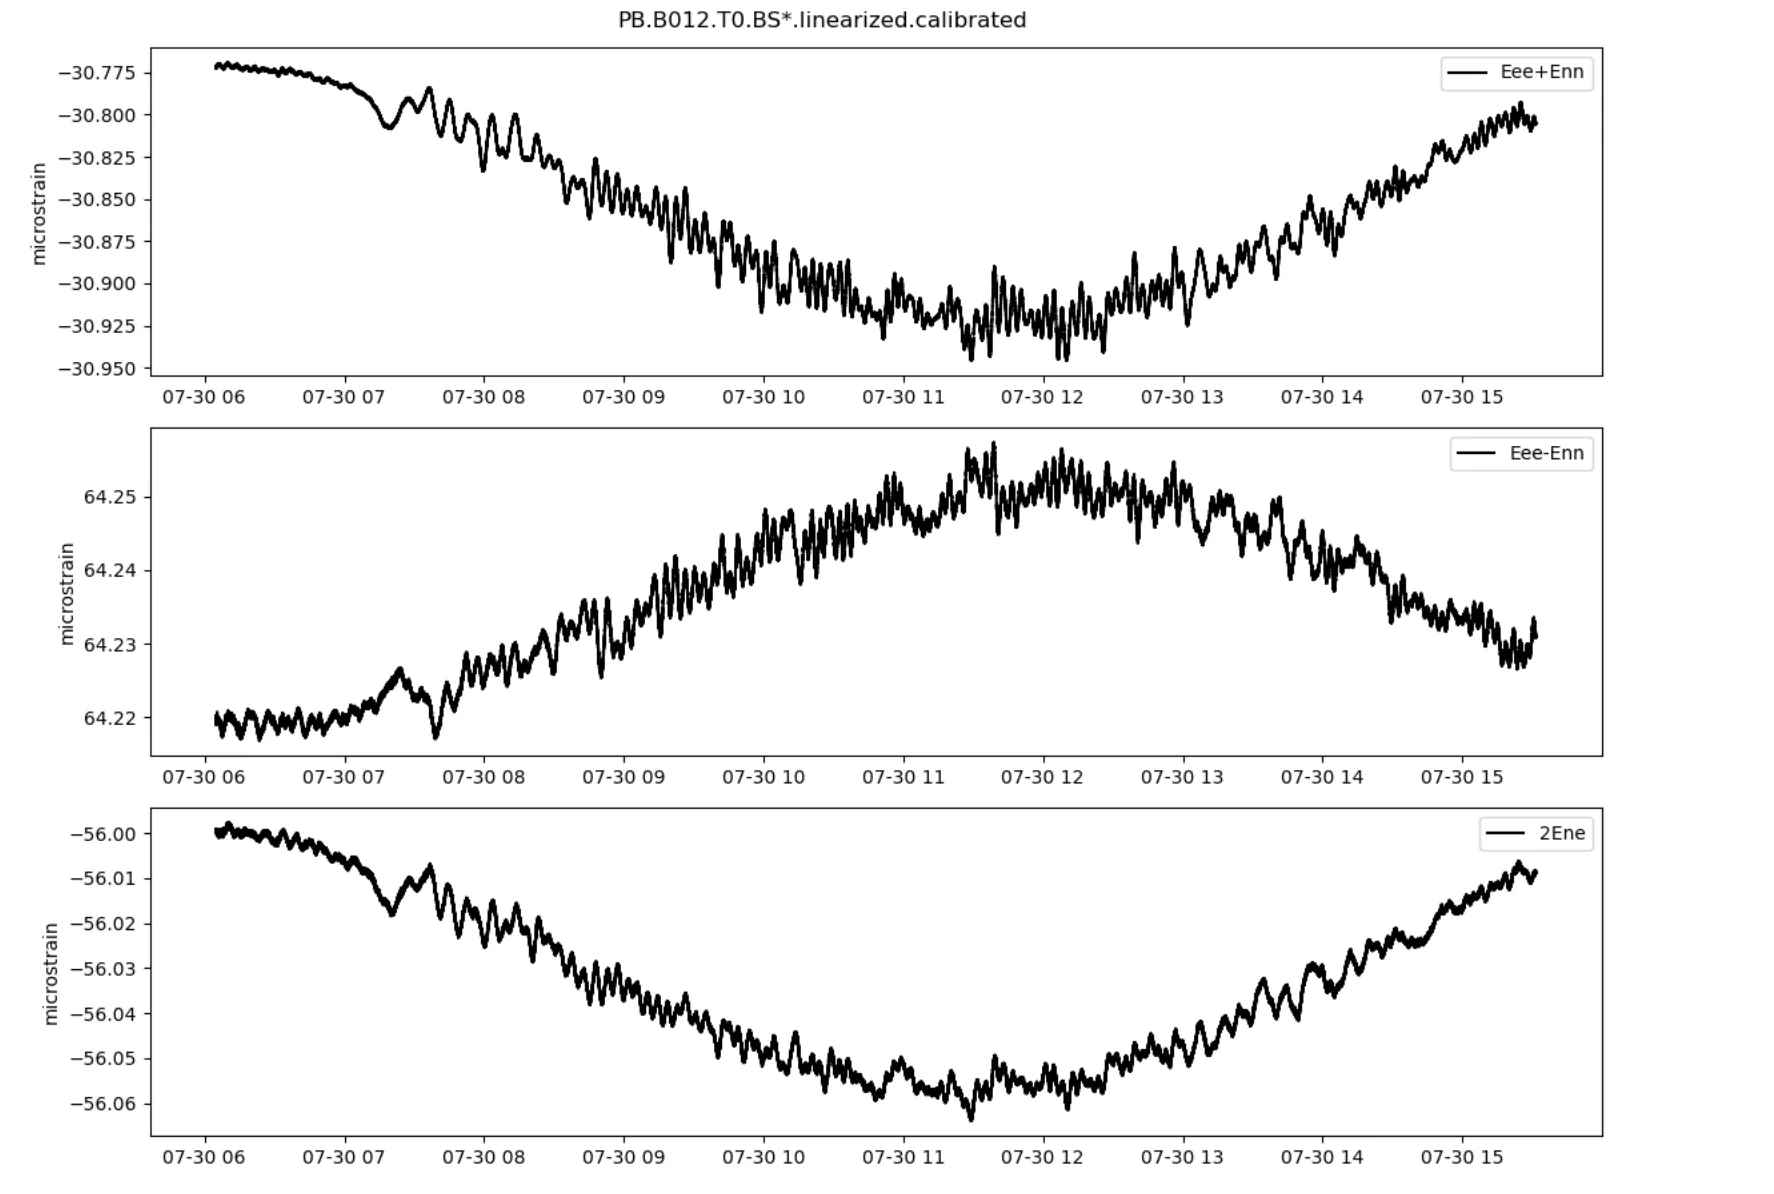
Borehole strainmeter B012 on the Pacific side of Vancouver Island recorded the effect of the tsunami waves. (Credit: Wade Johnson/EarthScope)
View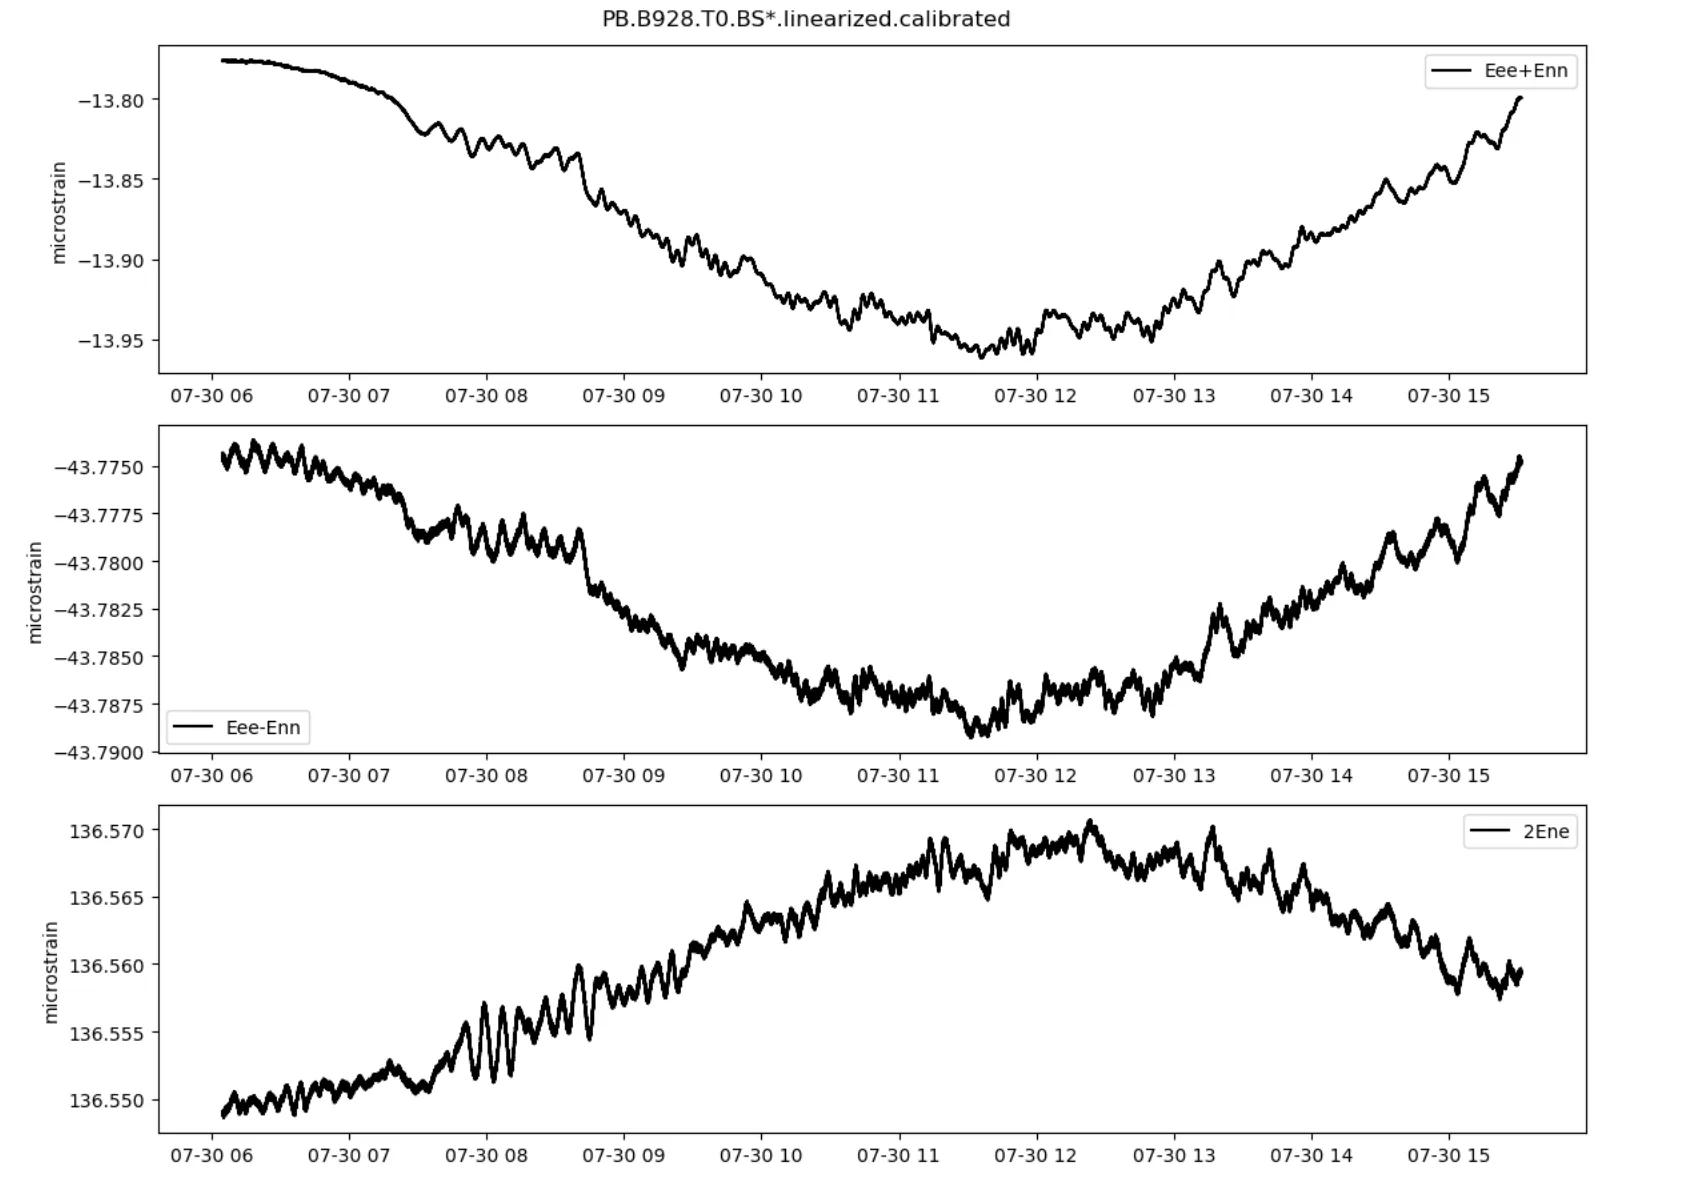
Borehole strainmeter B928 on the Pacific side of Vancouver Island recorded the effect of the tsunami waves. (Credit: Wade Johnson/EarthScope)
View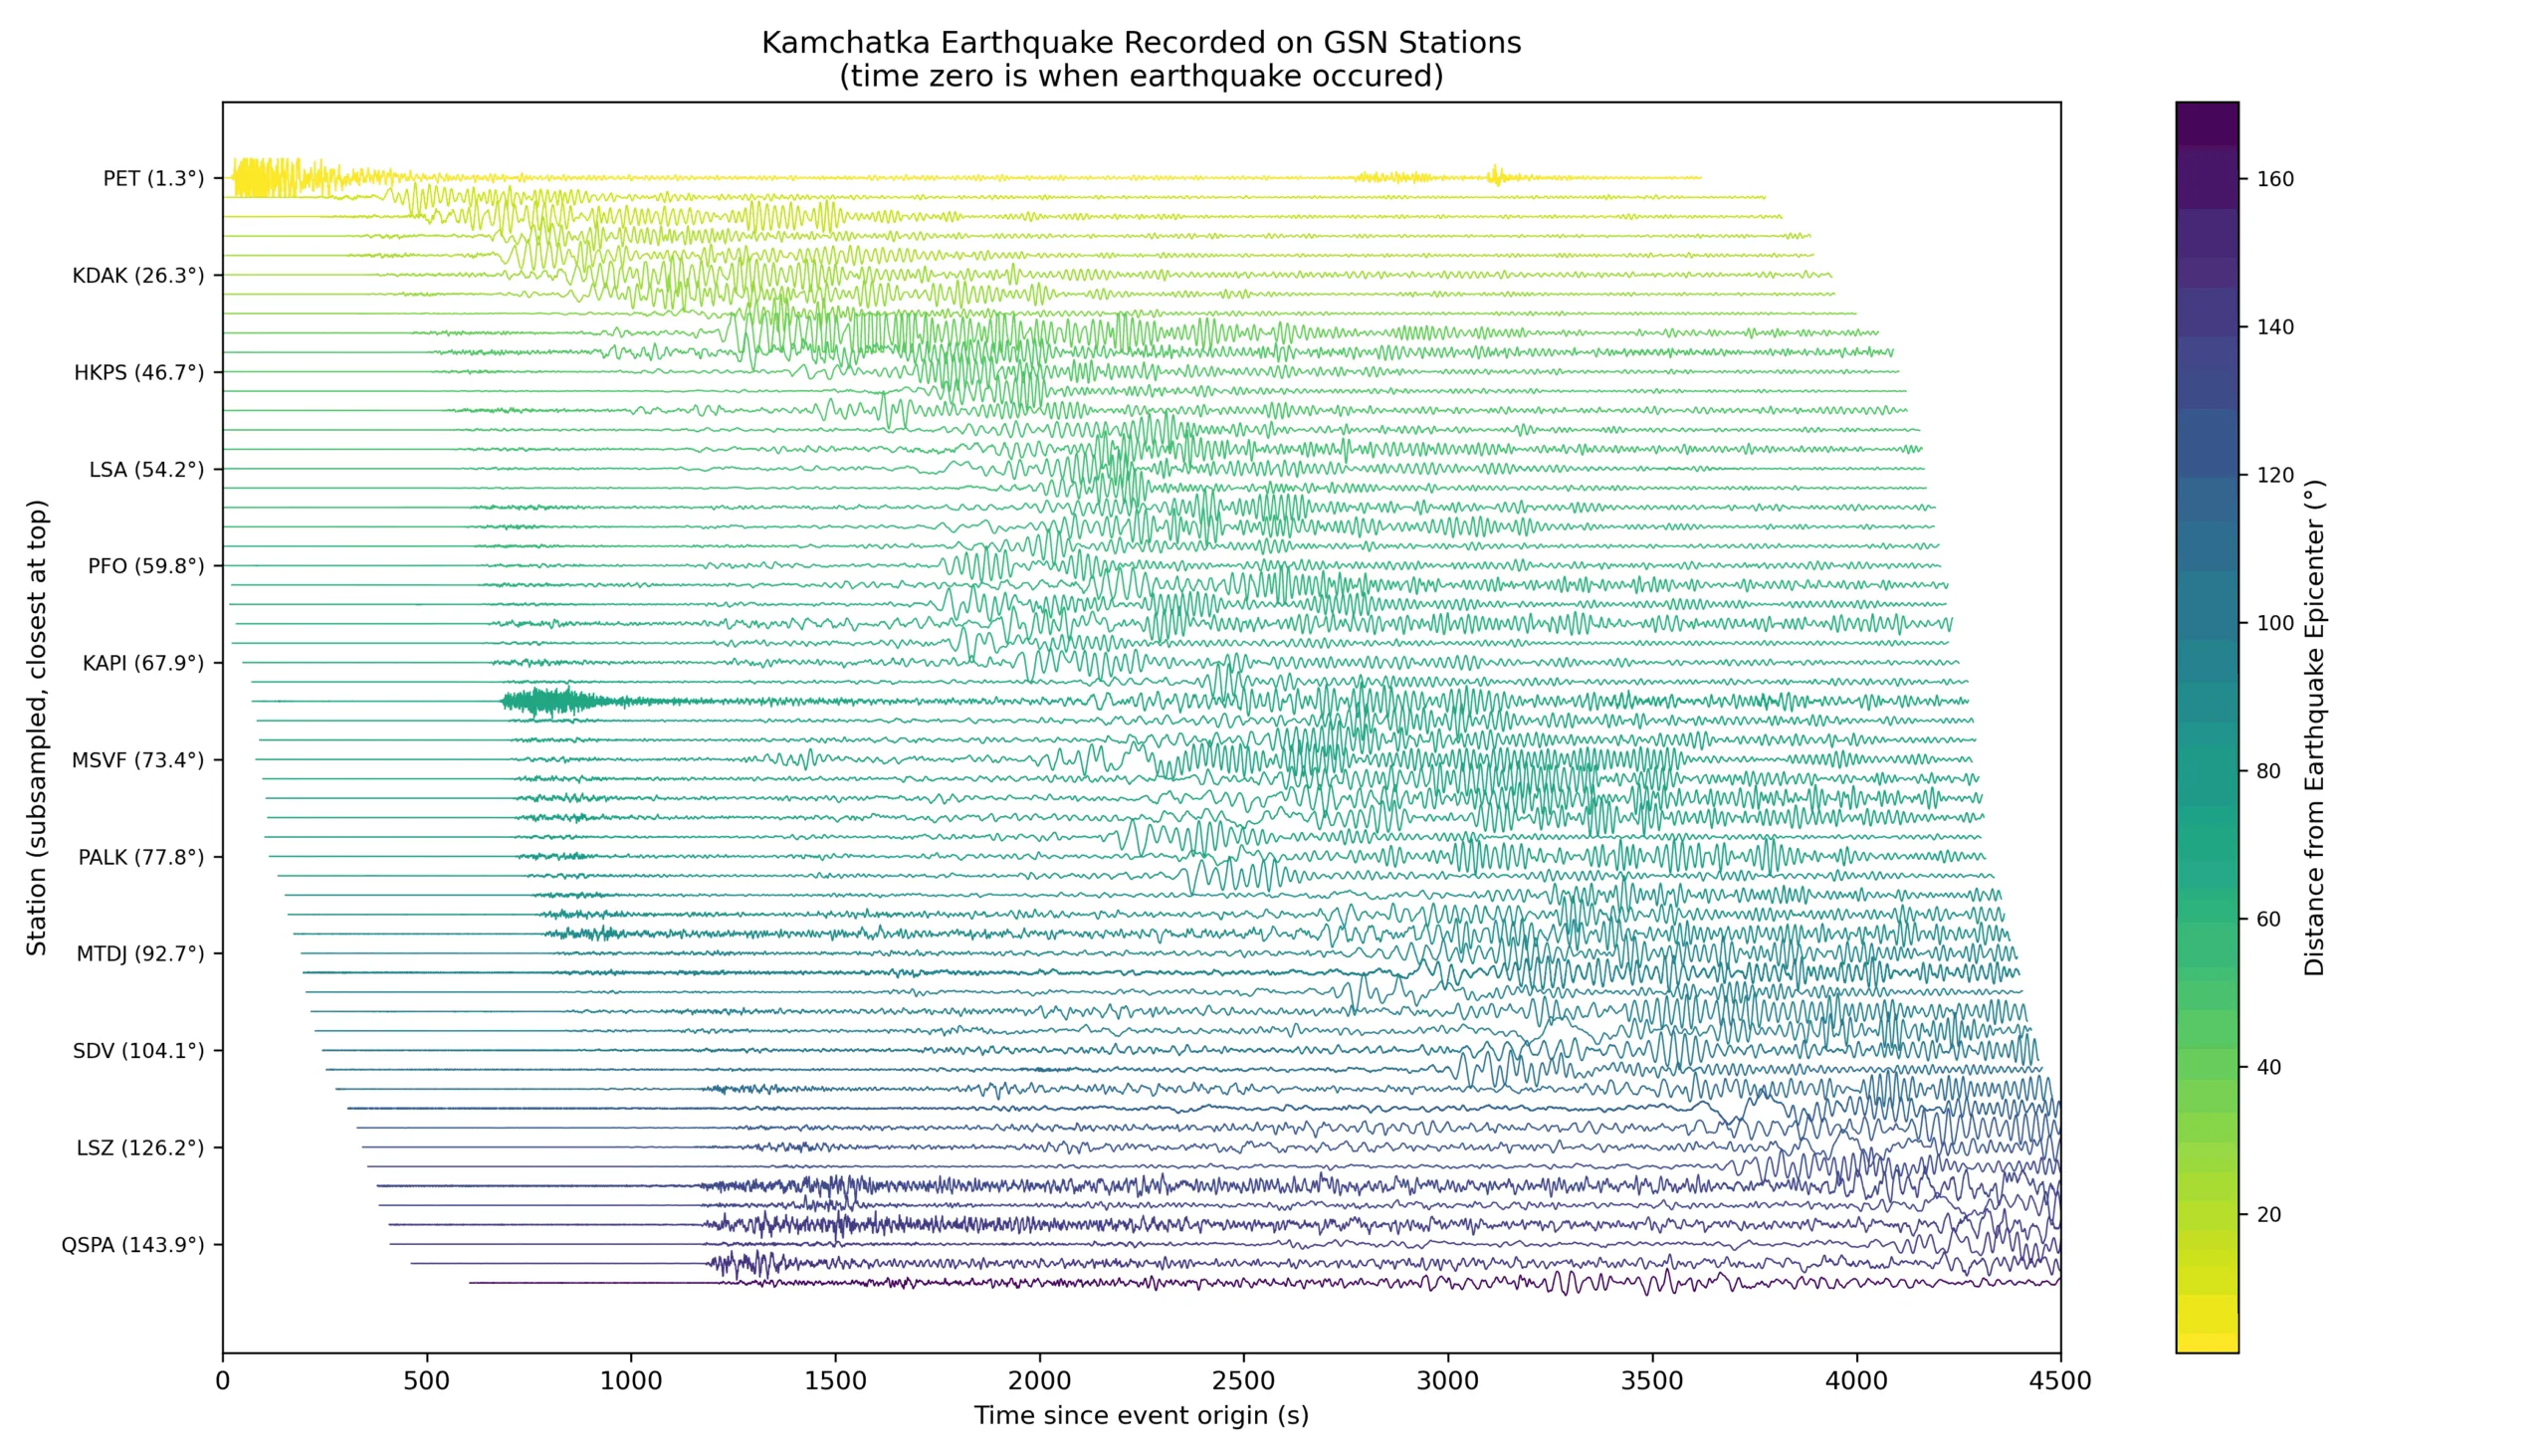
Record section from Global Seismographic Network stations. See map for locations. (Credit: Beck Hufstetler/EarthScope)
View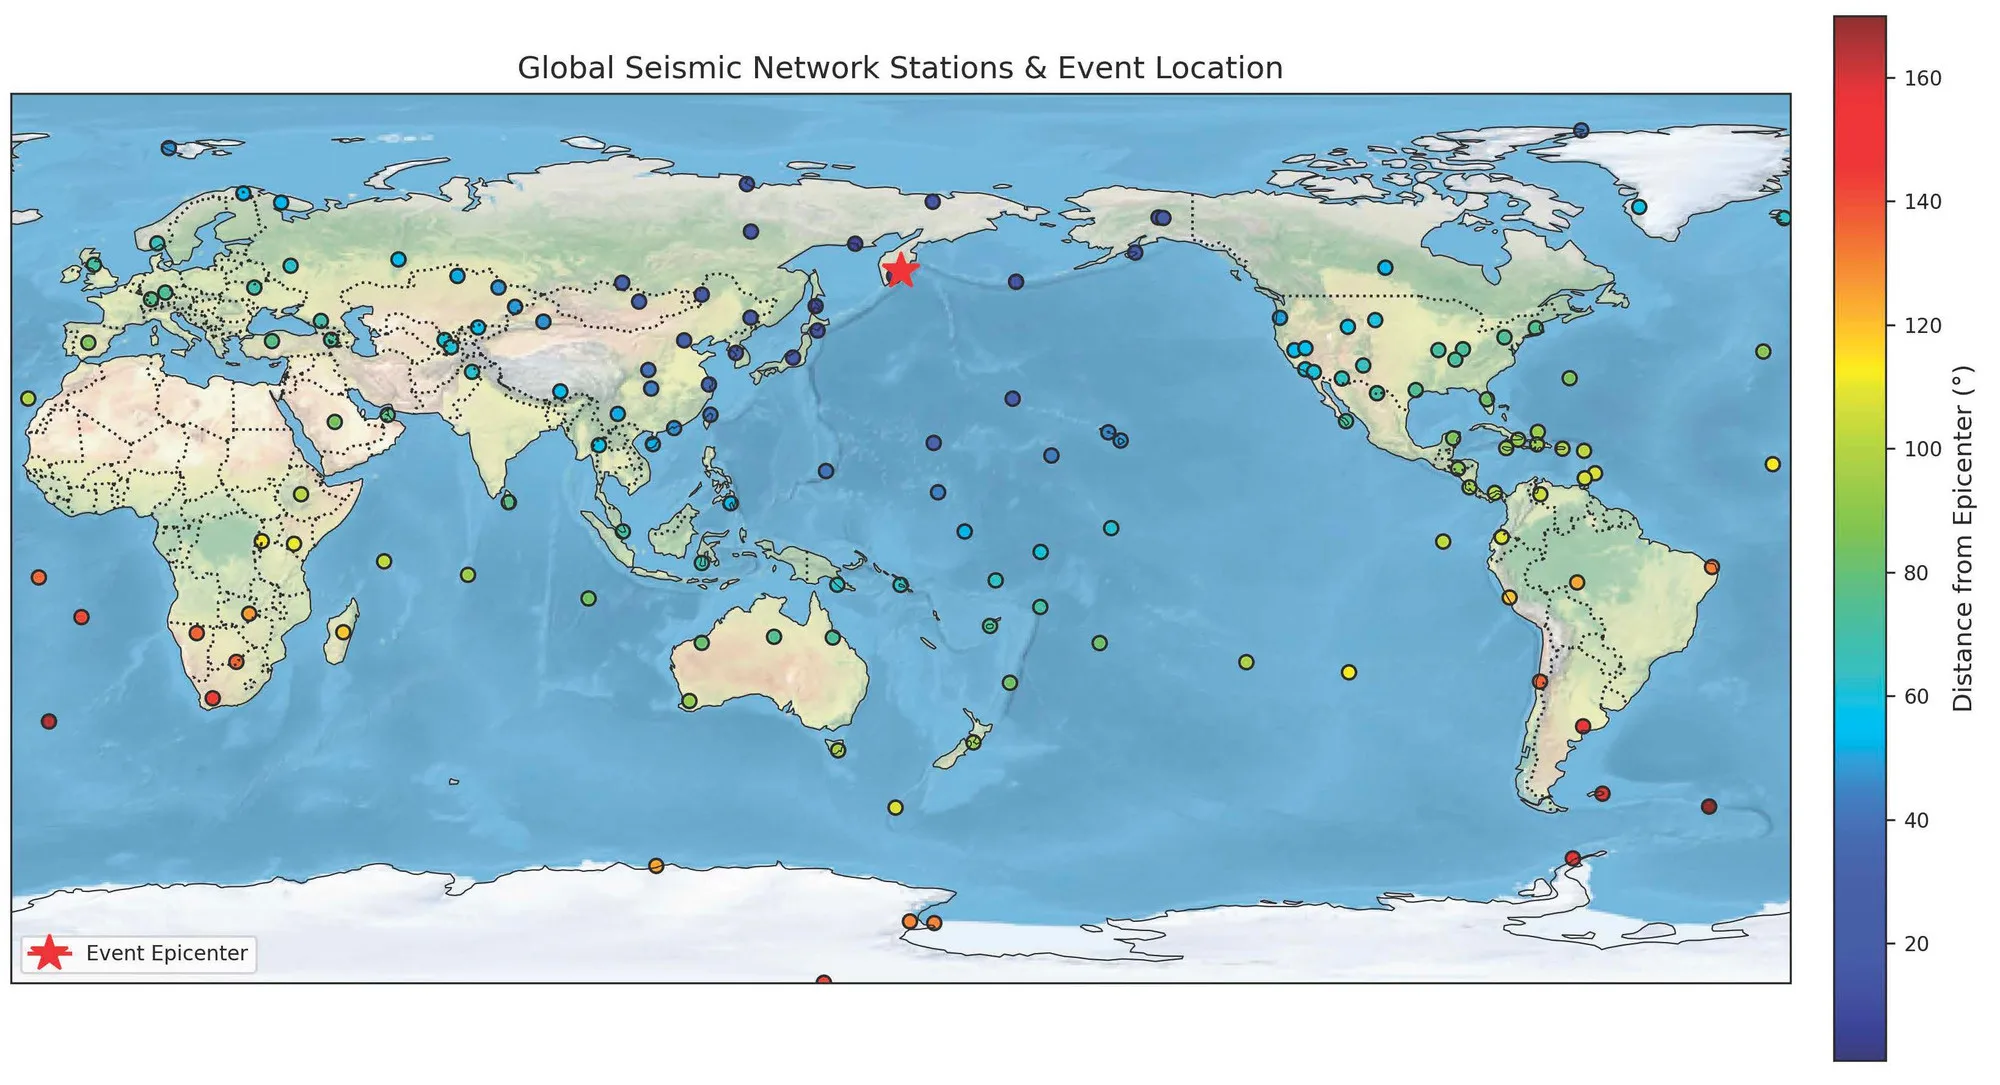
Global Seismographic Network stations, color-coded by distance from the epicenter as in the record section plot. (Credit: Beck Hufstetler/EarthScope)
View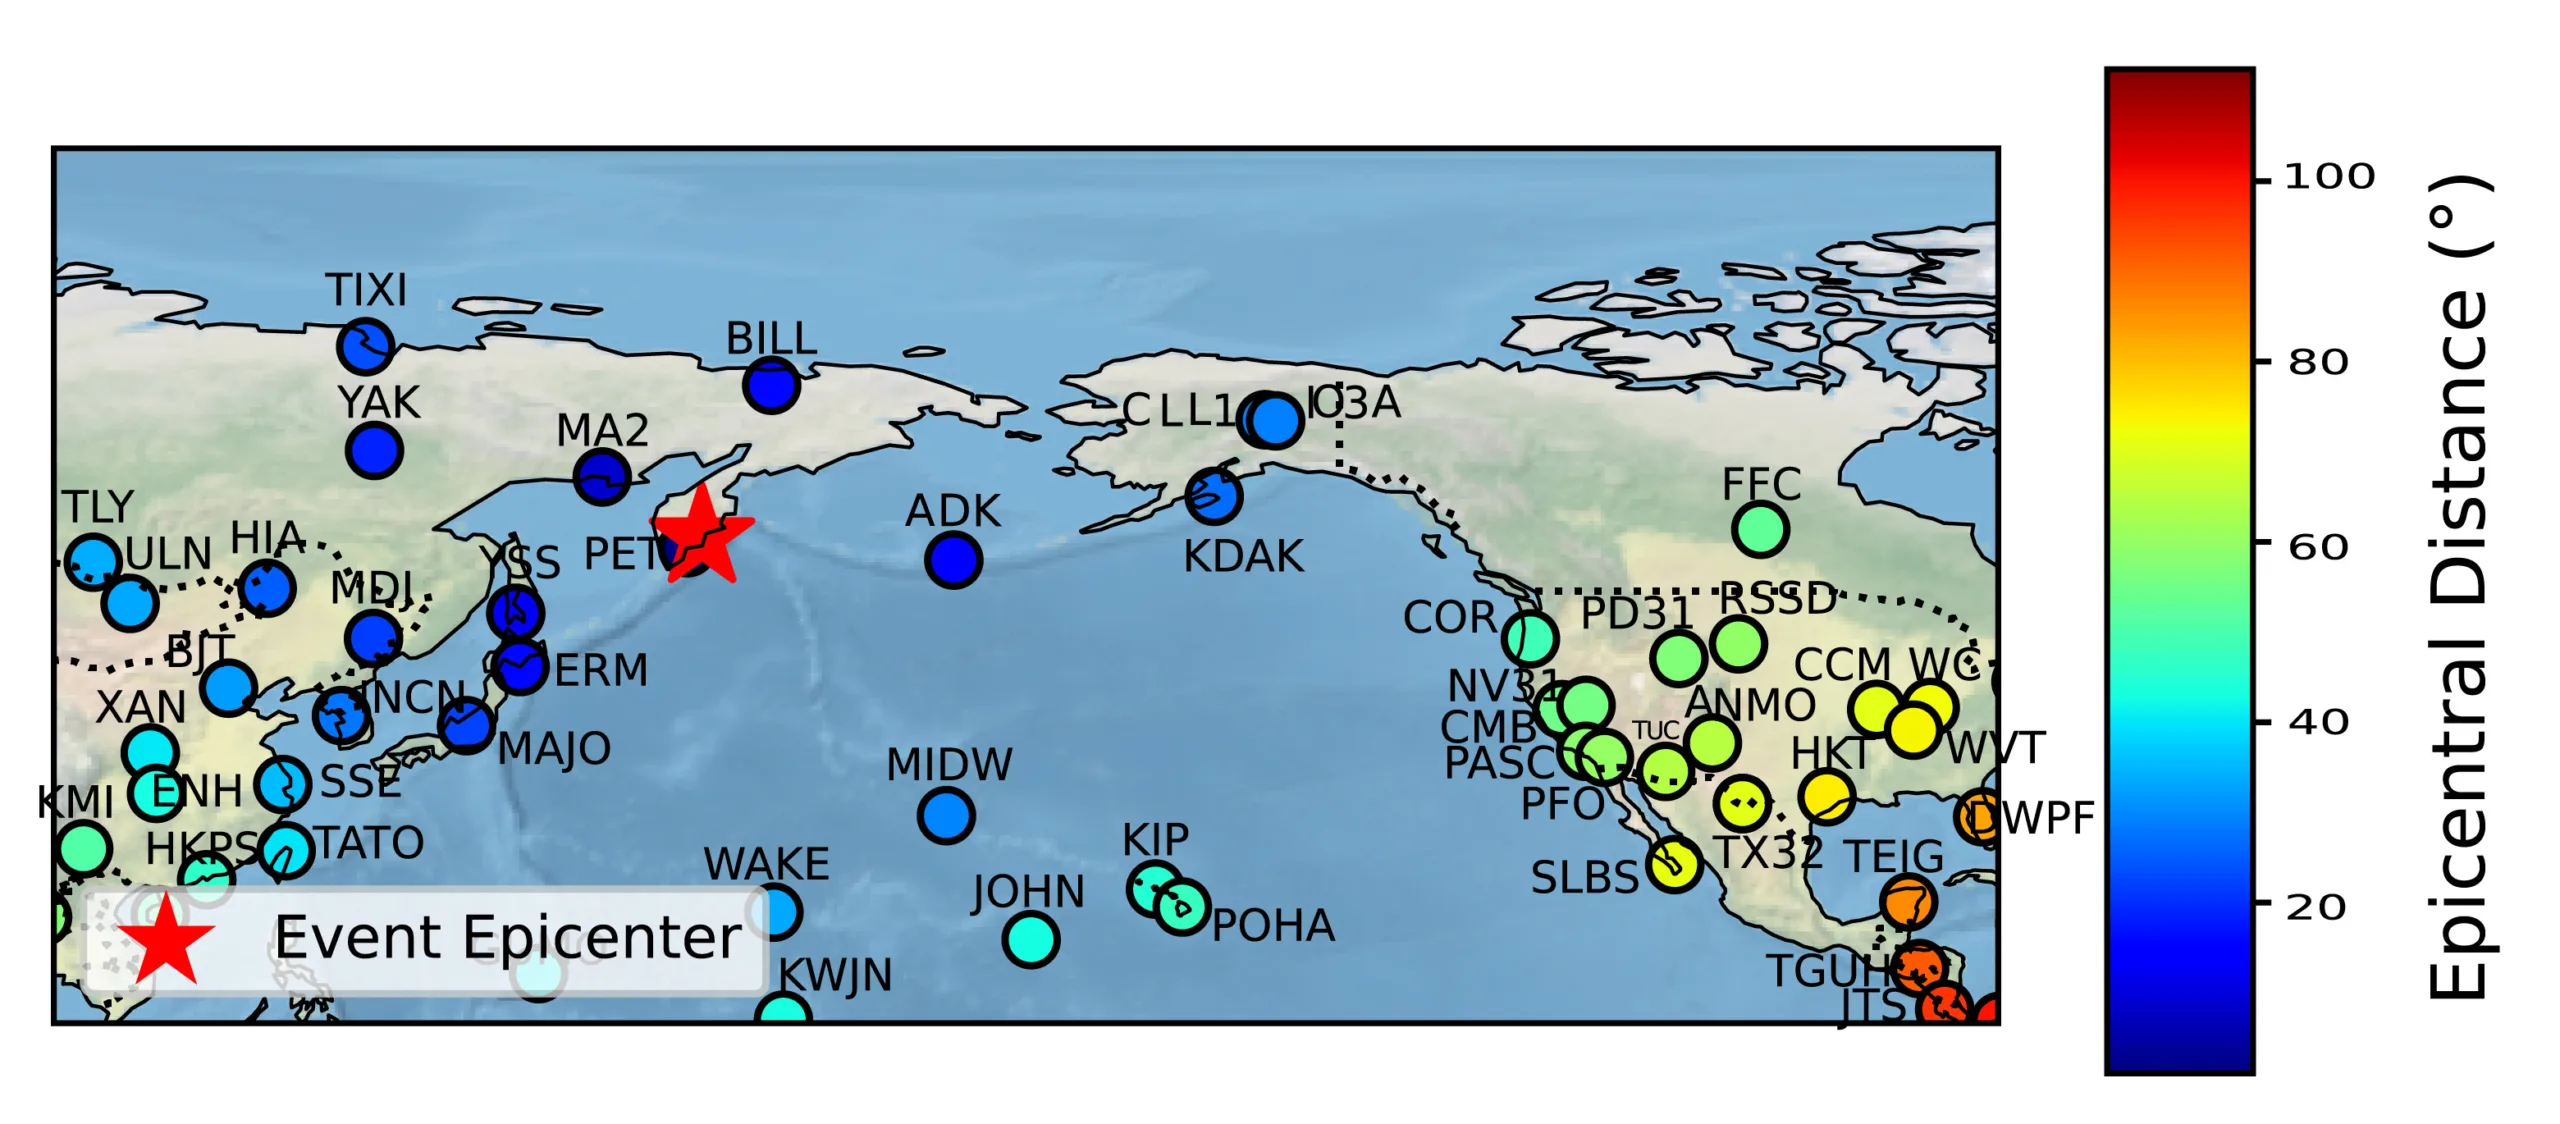
Global Seismographic Network stations near the region, color-coded by distance from the epicenter as in the record section plot. (Credit: Beck Hufstetler/EarthScope)
View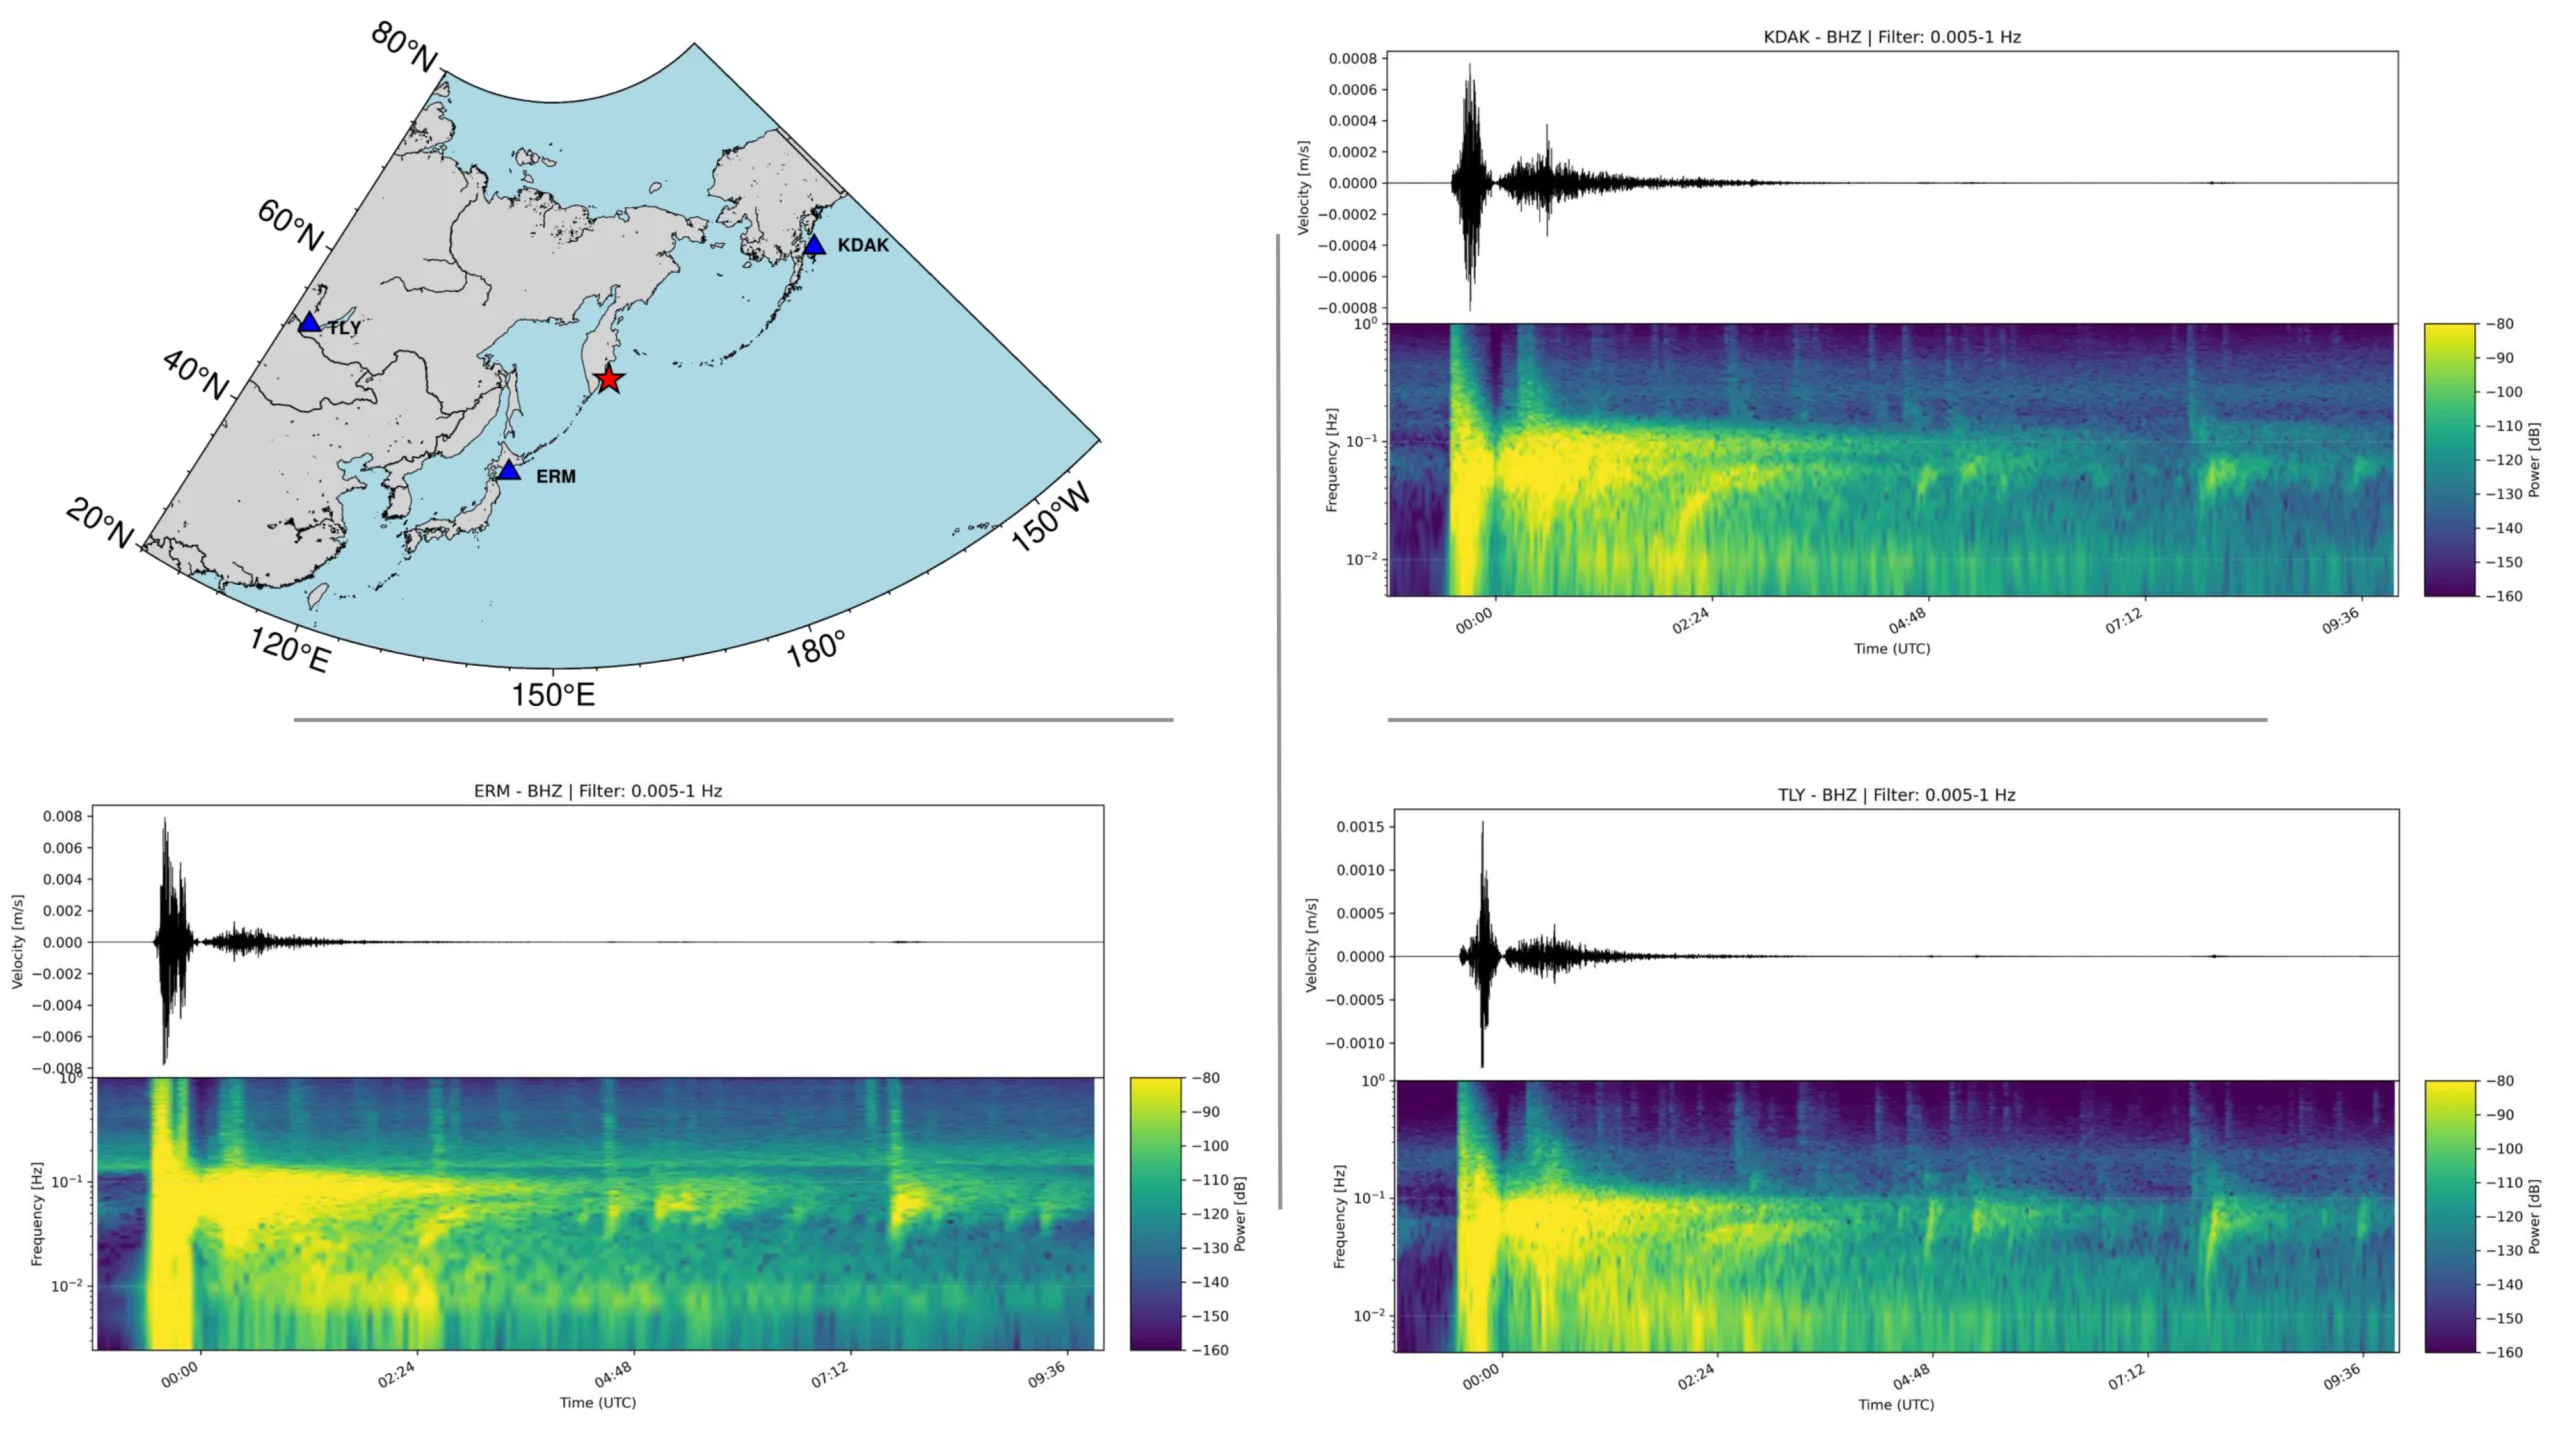
Seismic data from the three closest GSN stations operated by NSF SAGE. (Credit: Yelebe Amere/EarthScope)
View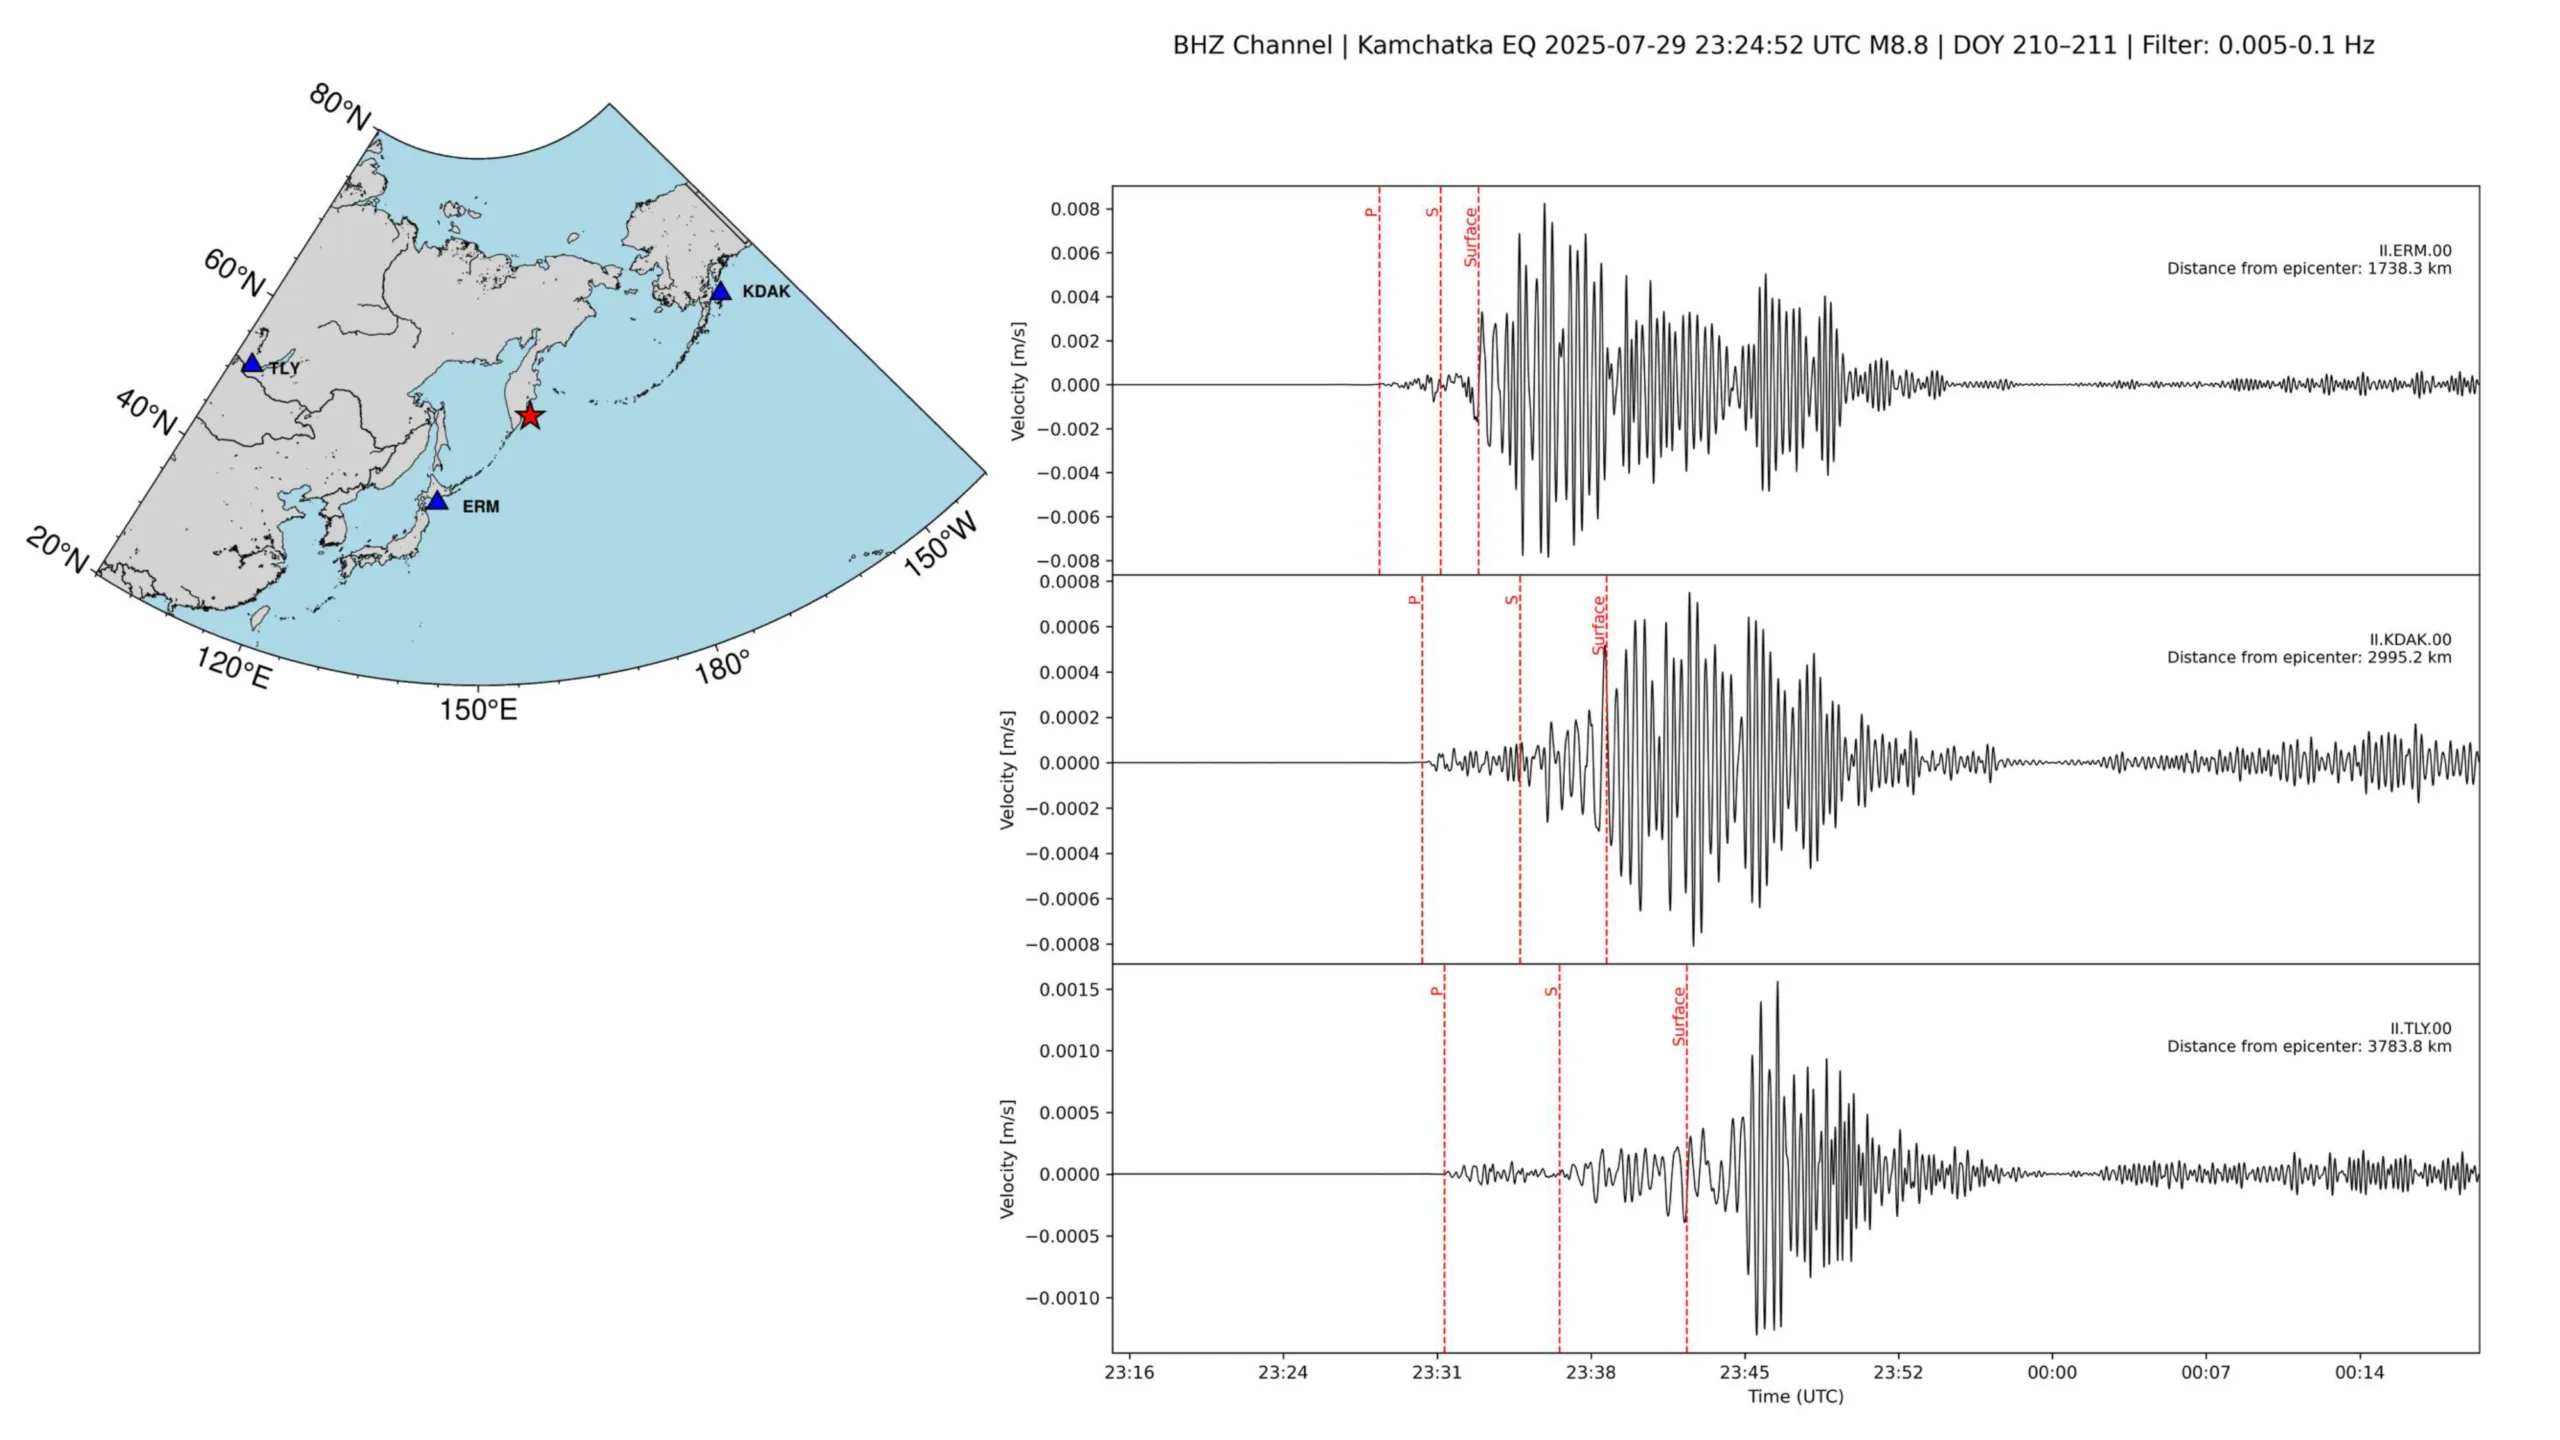
Seismic data with arrivals from the three closest GSN stations operated by NSF SAGE. (Credit: Yelebe Amere/EarthScope)
View